Clinical trials and how to make sense of them 

Clinical trials are how we find out if our treatments work. They are fundamental to the debates over psychiatry. They are the evidence for the profession’s effectiveness, and instruments for its improvement. Understanding them, what their results mean, and how much they are to be trusted is therefore a fundamental skill, not just for professionals, but for service users trying to “open the hood” and see how and why the treatments they were recommended gained credence. They also reveal why diagnosis is so essential to making progress with treatment.

This blog is therefore my attempt to demystify clinical trials sufficiently to allow people to begin to make sense of them, particularly now they are becoming increasingly available openly. As with all my blogs, I’m going to try to keep my language as non-technical as possible, while not simplifying the issues involved.

To do that, we first need to tackle maths phobia.

He doesn’t know it, but he’s looking at a recipe

Yes, just like this one

If recipes tells us how to select and process ingredients to get a result, mathematical formulae tell us how to select and process numbers to get a result.  The wonderful thing about numbers is that they can be used to represent anything at all, so we can do far more with them. In clinical trials, our first task is to try to represent ourselves, because we want the treatments to work on us, not somebody else.

The iid Assumption

We cannot avoid assumptions: trying to make none eventually leads to solipsism.

Descartes’ assumption of his own existence: even that’s been challenged these days, as this programmed brain shows

We are all unique, but also all who are reading this are recognisable as members of the human race (I’m assuming any dogs around can’t read)

It’s essential to be aware of the limitations of any assumption you make

The iid in the assumption we have to make stands for “identical and from identically distributed populations”. Though it sounds a bit repetitive, it isn’t.

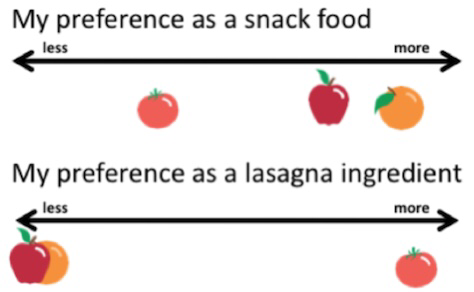
Here we can see two different populations; apples and oranges. So, the first i is an assumption that whatever we’re looking at can’t be divided like this.


Everything in the picture above is a tomato. So, they meet the first i criterion of our assumption. The obvious difference we see results from them breaking the id part. The the big and little tomatoes come from groups with different average sizes (and, if we look carefully, colours). So, their two populations do not have identical distributions for size and colour.

It’s also important to notice that iid is a decision we make, not a property of things in themselves. Take our first picture, of apples and oranges. If we were talking about fruit, then the picture would be iid, because we’ve blended the apples and oranges together.

Apple and orange distribution

Apart from being fun, the picture above also warns us that distributions are harder to understand than simple categories. We need to look at them in more detail.

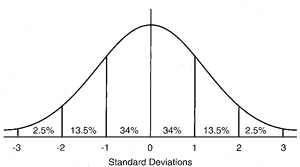
The standard normal distribution. Read on to find out what it is

To make a distribution, we need three ingredients

  • A population: that’s just a group of things. Quite literally, anything will do.
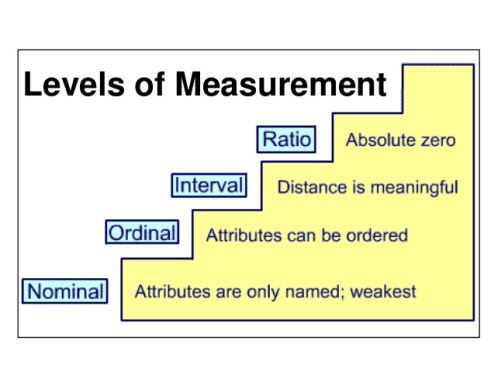
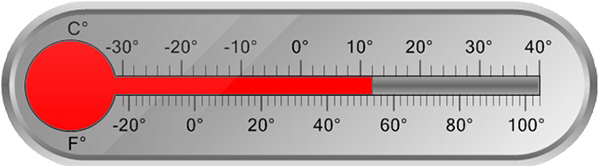
  • A dimension: some quality every population member has, but to a different extent. We are going to assume that the dimension can be measured using an interval or ratio scale, as described in my previous blog.  If you don’t want to read the blog, it’s a scale that works like an ordinary ruler. 
  • A measure:  something that can tell us when the population members differ on the dimension.

We use our measure on our population, and it gives us a range of different results, as we expect. The set of results (or values) we get is called a variable.  Using our values, we can now arrange our population along our dimension.

All nicely arranged. Yay! We made it!

That arrangement is called a distribution, and can be drawn, as we did for our so-called  “normal”  distribution above.  Distributions are usually drawn with their dimension (expressed as a variable) along the bottom (x-axis or ordinate). and the number of population members at each value as a stack, whose height is measured from the side (y-axis or abscissa).  In our  drawing, we’ve approximated the top of each stack by using a line.  There are actually lots of possible distributions, but we are going to concentrate on the normal distribution, for two reasons. First, even if our measure is perfectly unbiased, and therefore perfectly valid, there will always be some degree of random error (unreliability). When we measure something repeatedly, with only random error, the distribution of the measurements follows the normal distribution. Now, because of what iid means (that individuals in an iid population may be substituted for each other), we can claim

Provided the iid assumption holds, and for a given measure, measuring different members of a population is the same as measuring the same population member repeatedly

So, measuring an iid population with a good enough measure will result in a normal distribution of values, assuming the measure is at least an interval scale.  The second reason relates to sampling, which I talk about next.

Sampling and the normal distribution

God has the time, resources and immunity from boredom to fully measure iid populations.

Fancy measuring every hair in Longfellow’s beatd?

We do not. Fortunately, the iid assumption gives us an escape clause. Because all members of our iid population are the same, measuring the whole population won’t give us different information to a subset of it. So, we can sample. Sampling will, however, increase our measurement error, and unless we can say by how much, we’re stuffed, as the population distribution needs to be inferred from our sample. Fortunately, as our measure generates a normal distribution, this is estimable. If we look back to our drawing of the normal distribution above, we can see that we already know the proportion of our population in each part. If we know where the middle of our distribution is, and how widely it spreads, we can work out the rest. These quantities are called parameters.

The parameters of the normal distribution

We already know how to calculate where the middle of our distribution is; it’s the average value (mean), obtained by adding all the individual values up and dividing by the total number of values we used.

By convention, it’s usually symbolised as μ (greek for m). We write its calculation as

μ = Σ(x)/n where Σ means “add up all the x’s values”. Yes, it’s a recipe.

By analogy, our estimate of the width of spread is also a kind of average, though we call it the standard deviation. It’s calculated by subtracting the mean from each value, squaring them (which stops them adding up to zero), adding them together, dividing by the total number of differences we used, and then taking the square root to get us back to our original scale.

It’s symbolised by σ (greek for s) and we write its calculation

σ = √Σ(x-μ)²/n

Before moving on, it’s important to see what these parameters let us do. First, if we subtract the mean from every value, and then divide each value by the standard deviation we will end up with exactly our drawing of the normal distribution above: mean zero, standard deviation of one. Because this recipe converts any normal distribution to this one, it is called the standard normal distribution, and it’s very useful. Here it is again, in more detail

The standard normal distribution five ways

The first two ways are simply a repetition of its previous appearance, with the scale revealed as being measured in standard deviations. The third way is a scale of cumulative percentages of the population at and below the scale value. However, thanks to the iid assumption, that is the same as the probability that a member of our population will have a score of that value or less.  This means we can comment on either how typical the member is of the population as a whole, or, equivalently, how likely they are to be a member of our population, assuming we can trust our measure. The fourth way points out that we can as easily tick our scale using percentile as standard deviation units, if we don’t mind an ordinal scale, while the fifth shows that there are ways of adjusting the differences between different centiles so that  scale can be rendered interval once more.

Our recipe for the standard deviation has another trick up its sleeve. If we leave out the square root stage, we end up, unsurprisingly, with σ², which turns out to be far more interesting. We call it the distribution’s variance. If we think back far enough in our education, we remember that squaring was called that because it defined a square. For that reason, the variance measures the area under the curve of our normal distribution. Now, remember that curve is the result of how our population are stacked along our dimension. That means the area below it has all the possible information our distribution can give us, which the variance has neatly summarised into a single value. Furthermore, our drawings show us that that we can slice the variance into chunks, which allows us to make attributions to different amounts of it. This allows us to judge how how much of the variance might be accounted for by an attribute. We have something that can potentially tease out cause.

Sampling

There are two problems to solve when sampling

  1. How to get a representative sample
  2. How to use the sample to measure the population it represents

The sampling process

Getting the sampling right for a clinical trial is just as important as for a survey, follows the same process, but aims to collect a very different sample. We are seeking a representative sample of an iid population. However, as we have seen above, what we are going to call iid is down to us.  We might have good reason to want an iid sample of fruit, as opposed to one of apples and one of oranges, but clearly how we need to sample “fruit” will be very different to sampling “apple”, and interpreting results from an apple-orange combination that doesn’t really exist could cause us problems.

When we make the wrong iid decision in a clinical trial

What kind of iid decision should we make for a clinical trial? Step up, diagnosis, and take a bow.

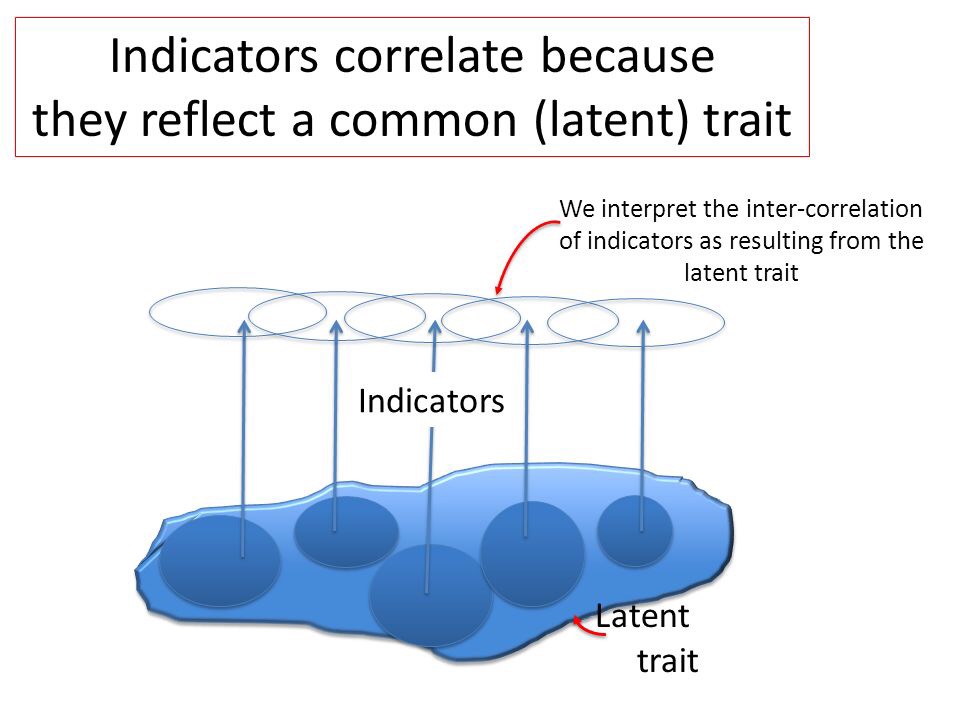
  • Diagnosis groups associated symptoms and signs together
  • These associations predict a common cause, even if that cause is unknown
  • There is a whole science (epidemiology) devoted to understanding populations of diagnoses.
  • In a clinical trial, the symptoms that make up the diagnosis are the target of our intervention.

Using diagnosis gives us a credible iid population to sample (in the diagram above, it’s our sampling frame). Because the diagnosed population is iid with respect to diagnosis, we can simply collect as many diagnosed cases as we need, and be confident our sample can represent the diagnosed population (in real life, things aren’t quite like this, but we’ll come to that later) We can now define the basic question our measurement needs to answer.

Does receiving a treatment stop a population being iid with those who did not?

Notice that our question implies no direction. If the direction is one we want, we talk of “effects”, if not, it’s “adverse effects”.

Also, because what we’ve got is a sample, that means we have a measurement gap to bridge.

From our earlier discussion, it follows that, when we measure an iid population appropriately, the distribution measures error, so our interest focuses on the mean. But now, each time we measure an iid sample, that error will give us a slightly different estimate of the mean. These estimates form their own distribution, with its own average degree of variation, called the “standard error of the mean”, which can be calculated.

The standard error of the mean (SE)

  • σ = population standard deviation
  • N = total sample size

SE = σ/√N

We’ve solved our mean estimation problem, but only if we can solve our standard deviation one. This turns out to be almost trivially easy. For a sample of any size, with a mean of m, the “sample standard deviation” s is s=√Σ(x-m)²/N-1.  Despite the confusing name, s is the estimate of  σ from the sample. As, under iid, m is an unbiased estimator of μ, we can substitute m for μ, and so calculate SE.  We’re all set.

Randomisation

In an ideal world, we wouldn’t need randomisation. We could simply give our intended treatment to some of our iid sample, measure, and see if that group remain iid with the others. However we’ve only ensured our sample is iid with respect to our sampling criterion. Reality is more like the diagram below.

The dots show they’ve all got the same diagnosis. But, they’re different colours.

In this example, we’ve only got colour to worry about. But, the very fact that we are not clones of each other means that, however carefully we are sampled, we will differ non-randomly on many dimensions: we are separated by more than measurement error. Any of these other dimensions could contribute to the course of the diagnosed disorder: epidemiology shows that they frequently do.

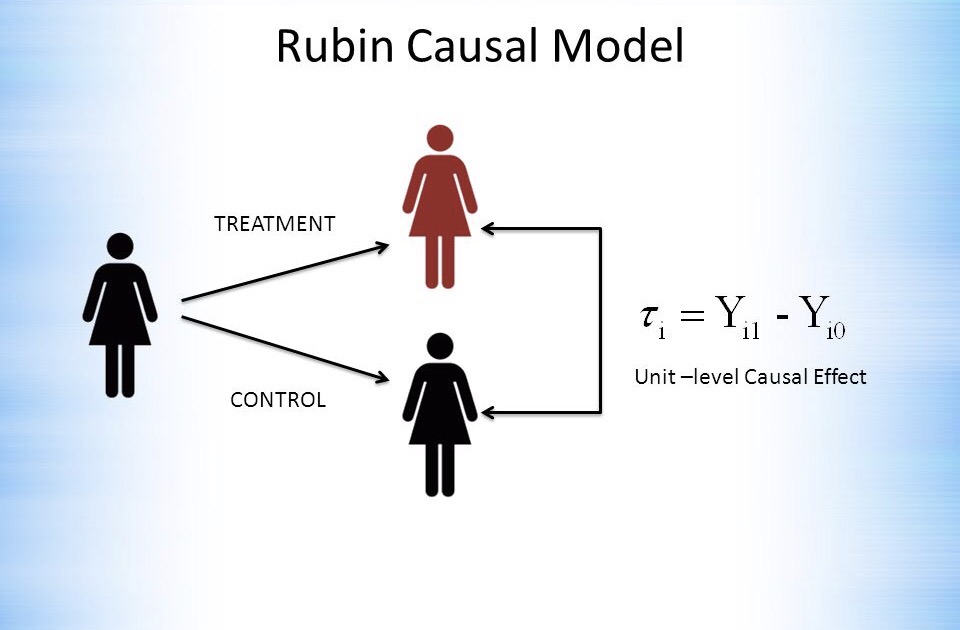
Ideally, we’d like the case and control to be the same subject

Rubin’s causal model is a useful way to understand how randomisation works to overcome this problem. As the image suggests, Rubin imagines two futures: in one a subject gets the treatment, in the other s/he doesn’t. The difference between these two futures is the “unit-level causal effect”. As the accompanying equation shows, it is no more than the difference we measure between the subject in these two futures. Of course, in reality we can access only one of those futures

Schrodinger’s cat: Rubin’s causal model in action at the unit level

However, a group of people who are iid with respect to another group allows measurement of a causal effect at the group level, because  the basis of iid is substitutability: either group can stand in for the other.  In a randomisation process, any individual is as likely to be selected as any other, so the individuals are substitutable in the process. So, two groups which result from a randomisation process are iid with respect to each other. This shows us two things

  1. As the randomisation process was done without respect to any dimension, the groups are iid with respect even to things we haven’t measured or recorded. Randomisation is unique in being able to guarantee this.
  2. The larger the groups, the better the approximation to iid they will be.

Clinical trials following these principles are called Randomised Controlled Trials (RCTs) and are generally considered the gold standard for assessing treatments, due to their unique ability to cope with unmeasured variables.

This chart shows how much difference controlling for unmeasured variables can make


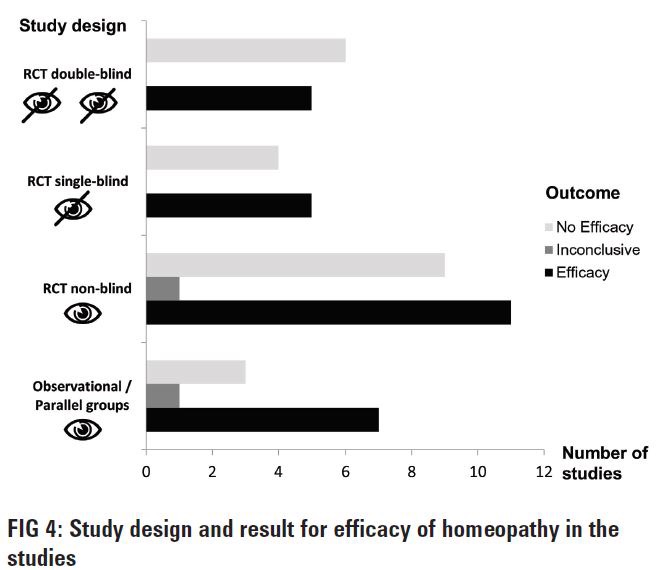
It’s actually not from a single RCT, but from what is called a meta-analysis, which groups studies together. There’s more on them below. The lowest set of bars shows that many more studies without randomisation support the benefits of homeopathy than do not, but that the balance corrects sharply when randomisation is introduced.

The chart also mentions another important feature of good clinical trial design: single or double blinding. This is part of accurate measurement, which we now need to discuss, as measurement is harder than it looks

Measurement

Those reading carefully will have noticed that the last chart talked about “efficacy” rather than “effectiveness”. This is because, even with randomisation, any new difference between our previously iid groups isn’t just the causal effect of the treatment. Unfortunately, what we measure has four components.

  1. Efficacy.  This is what we are after:  the part of the measured difference that is due to the treatment.
  2. Random variation. As we saw above, this is an unavoidable part of measurement, and its effect can be estimated. Even so, there are some measures that are especially sensitive to its effects. For example, hospital admissions occur when things are especially bad, and discharges when they are better. Random variation will therefore tend to exaggerate differences based on these two measurement points.
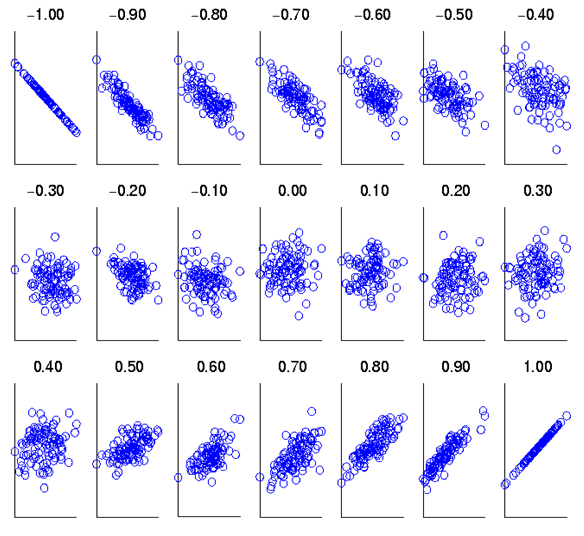
  3. Regression to the mean.  This is actually a consequence of random variation. Think back to our standard normal distribution.  Measurement of an iid sample will lead to our values clustering round the mean. So, if we measure a subject from that sample, and find an extreme value, measuring s/him again will most likely return a value closer to the mean. The size of this effect can be calculated from knowing how strongly the two measurements are associated.  This association is described by their correlation coefficient r

    Showing how the correlation coefficient relates to the strength of association between two variables

    and the proportion of an effect caused by regression to the mean is 1-r. Clearly, the more reliable a measure, the higher (and positive) r will be, and the less regression to the mean will be a problem.
  4. Placebo effect.  This is the effect expectation or desire can have on our measurement. While “placebo” implies that its effect will be benign, this is not always so, as bad expectations bias us in their direction also. When that happens, it’s called a “nocebo effect.”

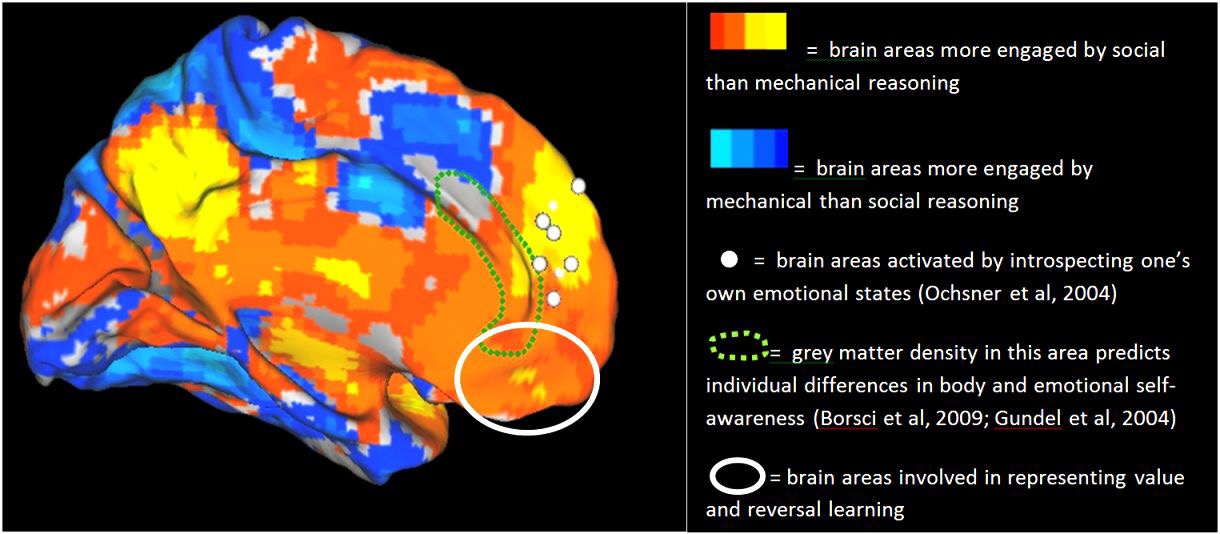
The placebo effect is not an artefact, as the diagram below shows, but a genuine psychological phenomenon, probably involving the dorsolateral prefrontal cortex.

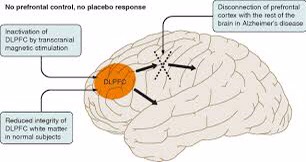
transcranial magnetic stimulation temporarily, and Alzheimer disease permanently, cause hypofunction in the dorsolateral prefrontal cortex. Both reduce the placebo effect

Treatments such as homeopathy, whose remedies contain no active ingredients, rely on the placebo effect for getting their results. “Blinding” means disguising the treatment in the trial, so that expectancy cannot influence our measurements. In “single blinding” the patients are unaware of whether they receive a treatment, but the researcher does know who gets what. In “double blinding” neither the researcher nor the patient knows what they’re getting. In the review of studies of homeopathy pictured above, you can see the balance between positive and negative results shifting towards negative as the level of blinding increased.

I have blogged about the importance of validity, and how it relates to reliability, elsewhere, so here I will simply observe that a valid measure is an unbiased measure, which we have already seen is an essential prerequisite for effective measurement

Analysis: simple or complicated

Simple

Complicated

In a very important way, analyses of clinical trials are like the two pictures above. Superficially, simple analysis seems to be giving us a lot less information than complexity.  However, think back to what our original question was: did application of our treatment stop our two groups being iid?   That’s not a complicated question. So, additional complications are doing one of two things

  1. Answering an additional question such as “how much of the variance (see earlier) in the change we’ve measured is due to our treatment (or some other causal factor).”
  2. Correcting for some flaw in the research design. 

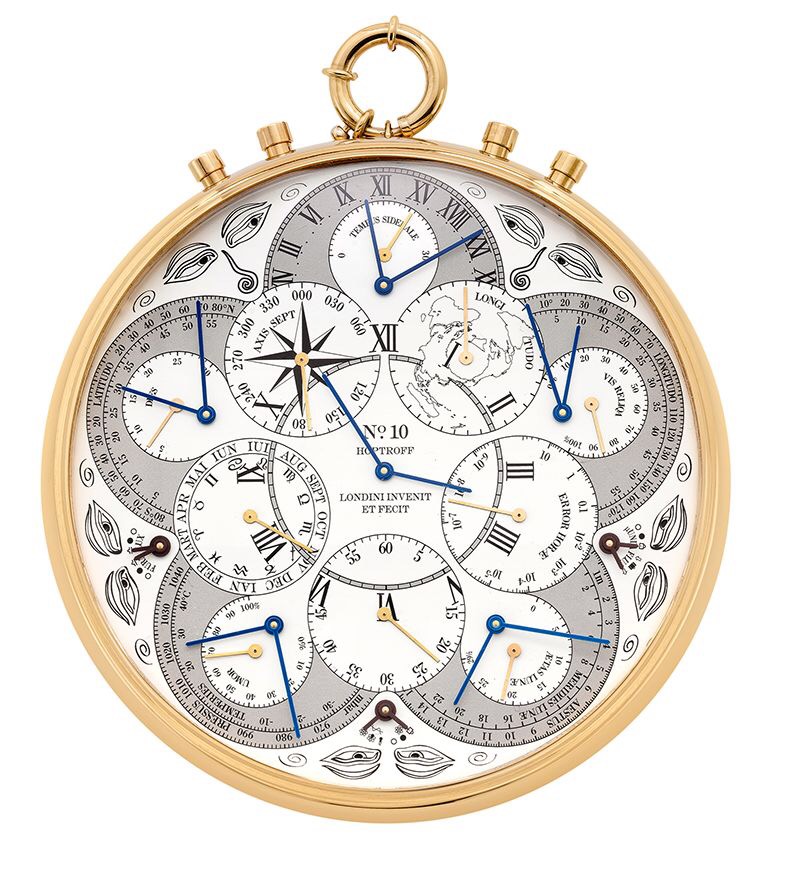
The trouble with complications, in both clinical trials and watches, is that they bring additional assumptions (not  least, that they will make things better rather than worse) and possibilities of error. Do we really understand what all those additional dials mean, and how they relate?  Nowadays, very complex statistical analyses can be run very easily on a computer. Unfortunately, understanding their subtleties has got no easier. This can be seen with a type of clinical trial called a cross-over study. 

Doesn’t look too complicated, does it?


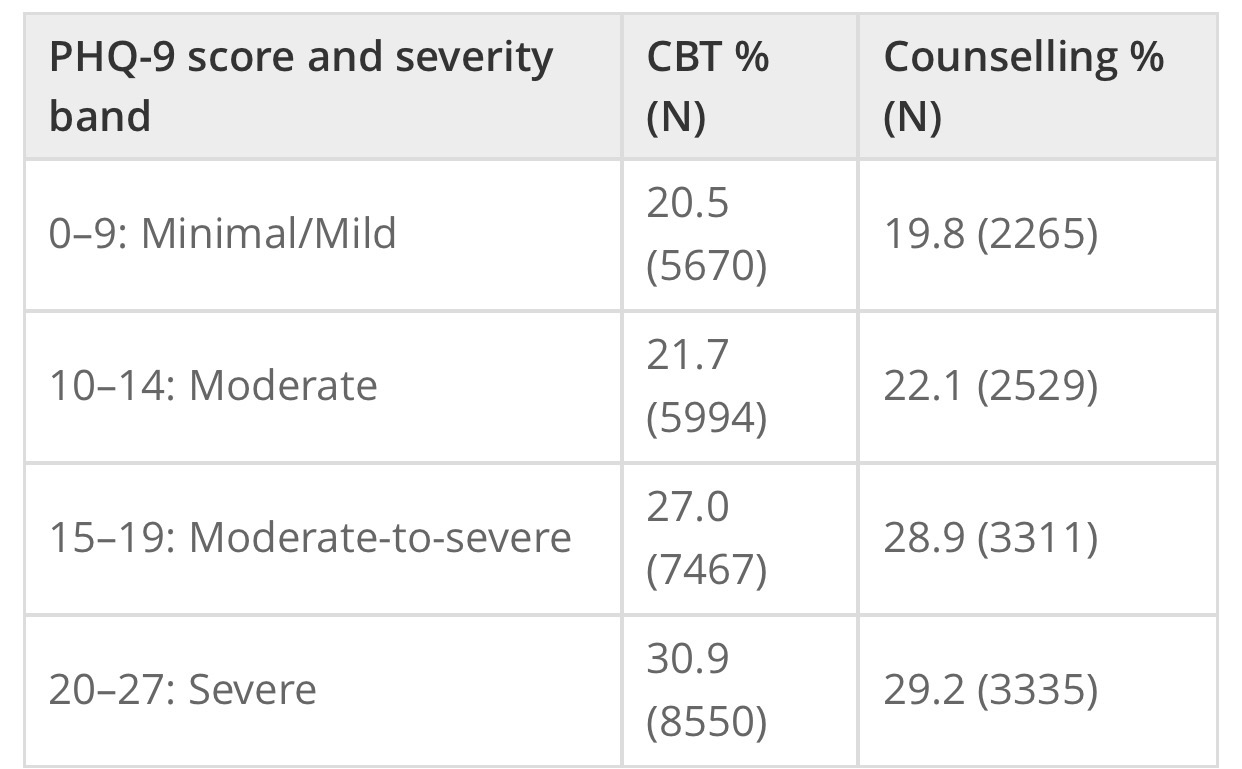
The advantage of a cross-over design is that each subject can act as their own control, thus bringing us closer to Rubin’s ideal. The disadvantage is that even major journals can fail to identify errors in the analysis strategies used. So, the more complex the analysis, the more carefully and clearly it should be explained. If the explanation doesn’t seem to make sense, it might be because it doesn’t!  Even charts can be misleading, if they’re not read carefully. Here’s some charts from a study (not an RCT) comparing two forms of psychological therapy in depression. 

While not mentioned in the paper, counselling has been traditionally understood to be more appropriate for people who are struggling, but whose difficulties relate to specific life problems, that might be expected to resolve. Even experienced psychologists have been known to misinterpret the lower chart as showing patients with counselling getting worse relative to CBT.  However, the upper chart shows that counselling, as predictable from its customary use, seems to have a preferred number of sessions, (around seven), while the continuous lines used in the lower chart are misleading. Checking the Y axis makes clear that there are different groups of subjects represented at each time point, so the lines joining them should not be interpreted to suggest continuity. What the chart shows is that a smaller proportion of people in counselling recover than people in CBT, when the number of sesssions attended rises beyond seven. 

Post-Hocery and how to avoid it

Read some statistics textbooks, and it would be easy to think that the way to proceed is to look at the data to get an impression of what it might be telling us (that’s called exploratory analysis) and then decide what we’re going to do. For clinical trials, that isn’t a good idea. The reason is easier to understand if I use an analogy.

Think of our treatment as an arrow, and the centre of the target as a cure. A clinical trial should tell us where on the target the arrow has landed.

In this context, exploratory analysis is like us test-firing the arrow a few times, seeing where it lands, and positioning the target accordingly. In itself, that’s not a bad thing, and is why we often pilot before undertaking a trial. But, here, we are using the same data from the same sample.  Clearly, moving the target means we can no longer claim that the difference we find reflects the impact of our treatment  This kind of analysis is called a “post-hoc” analysis. It can be useful in identifying other possibilities and potential areas for study, but to avoid post-hoc target moving, analyses in clinical trials need to be pre-planned. Nowadays, there are registers of clinical trials, which allow readers to check back and see if what was published matches what was registered. 

Putting everything together that we’ve covered so far, we are now in a position to set out a set of seven simple yes/no questions we should ask when ourselves when reading a clinical trial. 

  1. Has the sampling frame provided a    sample that is convincingly iid?
  2. Have the groups been properly randomised with respect to each other?
  3. Are the randomised groups large enough to be convincingly iid with respect to each other?
  4. Has blinding been used?
  5. Do we know how valid and reliable the measures are?
  6. Is there a simple analysis that shows whether the groups are different or not?
  7. Was the analysis pre-planned?

      When using this list of questions, a “don’t know” should be treated the same as a “no”.  In general, the fewer questions we can answer “yes” to, the less we should trust a clinical trial’s claims about the treatment it is investigating, and the more corroborative evidence we should seek. 

      Let’s apply these questions to the study on comparing counselling with CBT we used as an example above. 

      1. The study published a table showing both therapist types saw cases of similar severity 

        PHQ-9 is a depression measure

        which suggests that the sampling frame they used did provide an iid sample. It’s a “yes”. 
      2. That’s a clear “no”.  As the groups weren’t randomised, we can’t be sure they were the same on unmeasured variables. As discharge is driven be either patient recovery or desire to continue, then, given the charts, it seems likely the two groups weren’t. 
      3. The sizes reported in the table are very large for mental health studies, so that’s a “yes”
      4. Another “no”
      5. The study references the PHQ-9’s reliability and validity studies, so that’s a “yes”
      6. Despite my example with the charts above, there is such an analysis in the study. It reported 46.6% of patients receiving CBT improved, versus 44.3% of patients receiving counselling, if the patients met diagnostic criteria at outset. The comparable figures, including also people who did not meet diagnostic criteria, were 50.4% vs 49.6%. We can now see how misleading those charts were!
      7. The study report isn’t clear on this, so it’s a “don’t know”

      We can see that our questions don’t return a clear “yes or no” answer to how much trust we should place on the study. My own take home messages are that counselling and CBT might be best for different patients, but neither is going to get more than half of those they see better. 

      The trial has reported its results were significant. What does that mean?

      Years ago, that statement was synonymous with “Yay! It works!”. We now know better. Let’s think about a very simple RCT, with only two groups, one treatment, and one outcome measure, with an interval scale. In this context, the term is short for “statistically significant”: after the treatment, when we measured the means of the two groups, they were sufficiently different to say that, even allowing for error, there was a less than 5% chance of them being means of the same group, so the groups were no longer iid.  This 5% limit has been arrived at by custom, but if we look back at where it cuts the normal distribution it’s outside most of the mass of the distribution, so it kind of makes sense.  

      However, if we look back to how the standard errors of our two means are calculated, then we can see that they will shrink the more cases we have. At very large numbers, we will be able to detect tiny differences: statistically significant, but practically pointless. What we need is a measure of what is called effect size.  For our example, the difference between the two means, measured in standardised deviations, the “standardised mean difference” (SMD) works well. The table below gives some ways of interpreting it. 

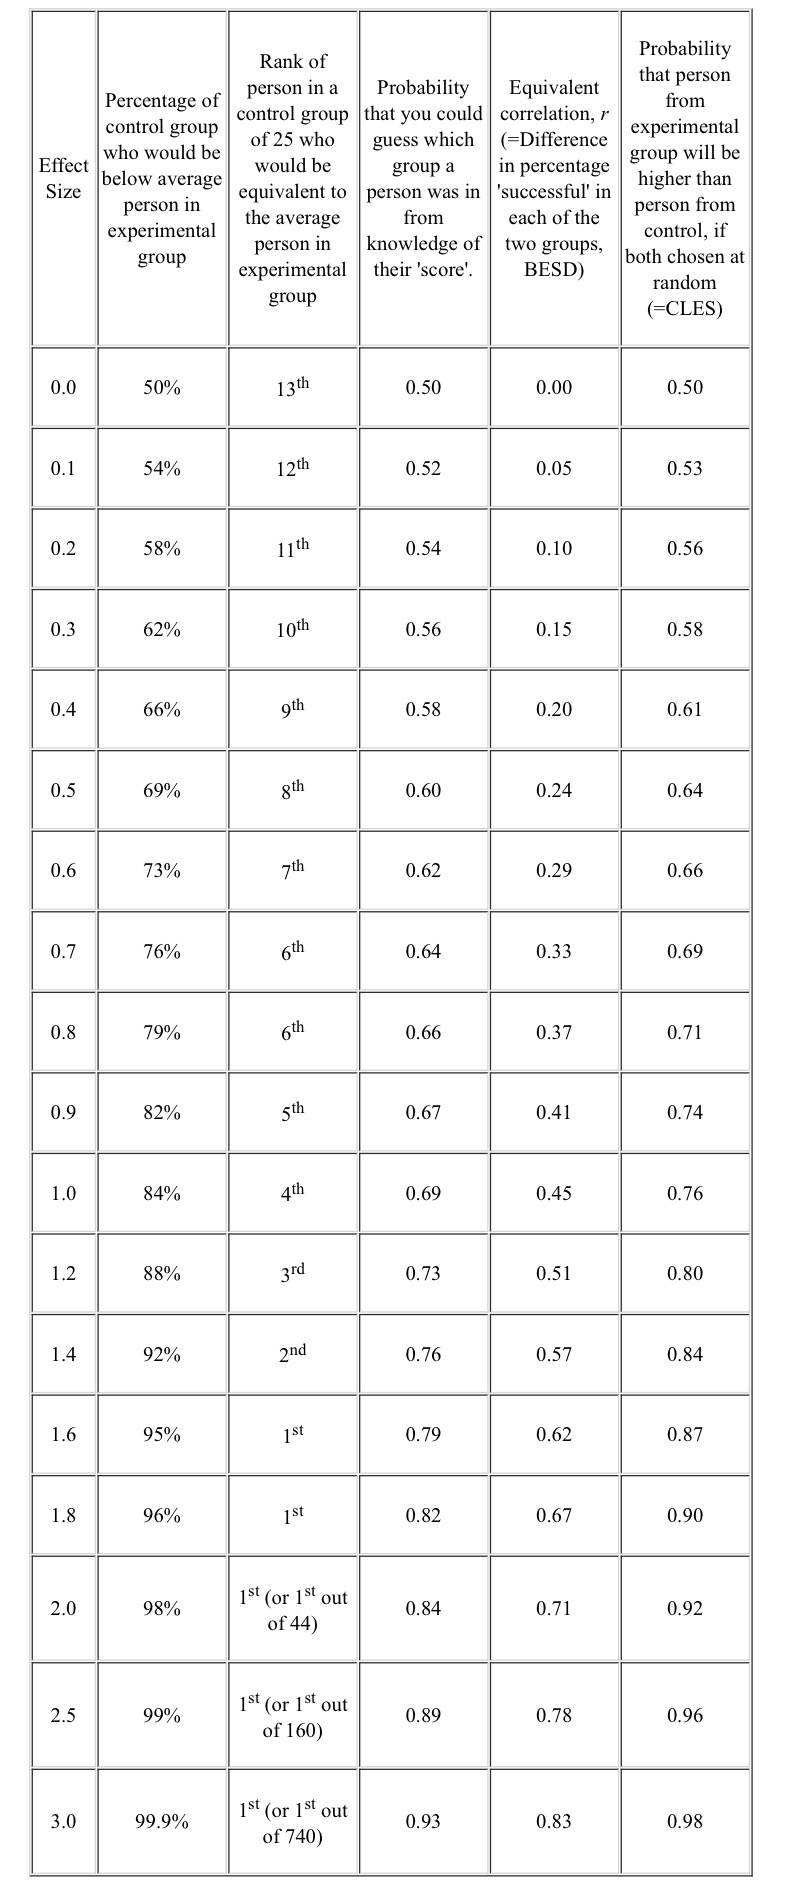
      BESD Binomial Effect Size Display CLES Common Language Effect Size

       Most treatments available in Mental Health that have been tested by RCT have an effect size (SMD) between 0.5 and 1.2. This is pretty average compared to equivalent treatments for physical conditions,  but does show that we should not expect even our best treatments to work all the time, and we need more than one treatment for any condition. 

      Thinking back to our example study, the 50% recovery rate can be related to the 4th column (none were recovered before, around half were afterwards, so the BESD was around 0.5), and equates to an SMD effect size of 1.2. However, the lack of blinding, and the use of “admission” and “discharge” endpoints are all likely to have inflated this figure, while lack of randomisation will have had an unpredictable effect. 

      We have derived our concept of effect size as standardised mean difference from the normal distribution. However, even when our outcomes are a simple yes/no, we can calculate a SMD from it. This has been very useful when combining studies together, which is our next topic. 

      Systematic Reviews and Meta-Analysis

      Let’s start by clearing up two common mistakes 

      1. A systematic review is not a meta-analysis 
      2. A meta-analysis is not necessarily better than a well designed single clinical study. 

      In times of yore, all reviews were what are now called “narrative reviews”, which are basically stories justified by references. While obviously valuable when it comes to making sense of things, bias, and the pressure to make some sense, leads to reviews which may support either “yes” or “no”, when the right answer is “I haven’t a clue.”

      Doing a narrative review is all about choosing…

      Systematic reviews don’t start with a library, but a computer. The idea is to use one or more search engines to identify–as this is about clinical trials–all the trials that have been done on a treatment, in theory since the treatment was first discovered but usually within some reasonable time frame. At this point one of two things can happen 

      1. The reviewer decides the studies can’t be meaningfully combined, so writes a narrative review of the different stories they tell, and explains why any combination won’t work. 
      2. The reviewer decides the studies (or at least some of them) can be combined as if they were one big study. The processs of doing this, and interpreting what comes out, is callled meta-analysis. 

      Whether the studies can be combined will depend on the extent they can be considered iid with respect both to each other and the population, and that’s a big ask.  

      Same thing, different researchers, different methods, different results

      To solve this problem, we assume that better designed studies about the same thing are likely to resemble each other more, as there are always more ways of being wrong than right. So, when reading a meta-analysis the first thing to check is how they decided which studies to put in. A lot of scholarly activity has gone into designing good criteria, such as these. The chart of studies of homeopathy shown above indicates how much including studies of different quality can change results. We can check whether the studies are sufficiently similar to combine statistically, when it’s called study heterogeneity.  Here’s a graphical example, which helps explain what it means. 


      The horizontal axis reports the percentage recovered in the control group, while the vertical axis does the same for those receiving treatment: this is a way of looking at BESD correlations. The diagonal line splits the chart into two halves. For anything in the upper triangle, treatment is more effective than control, while the reverse holds for the lower triangle. The studies form a reasonably tight group, suggesting similar BESDs, supporting the view they might be regarded as iid. The dashed line is the best straight line we can draw through  all the studies. We can see that the two big studies (the largest circles) have dragged the line firmly to the left. If they were both from the same group of researchers, a reviewer might want to look at them more closely. 

      Another source of bias is called the “file drawer” problem: studies that give negative results are less likely to be published.  One way of detecting this is by a funnel plot, as shown below. 

      The horizontal axis measures the effect size (SMD), as discussed above. The vertical axis measures the standard error of each study. The analysis’ studies are all plotted as points on the plot. The two straight lines forming an isosceles triangle (the funnel) are either edge of the boundary of the 95% standard error of the effect size for a given standard error. The apex of the triangle is set at the average effect size the study calculated. The central vertical makes it easier to read.


      This is from a real meta-analysis of talking therapies for adult depression.  From what we’ve covered above about effect sizes and standard errors, we’d expect the dots splattered pretty evenly around the divided triangle,  but that’s clearly not happened here. In this analysis, a positive effect size favours treatment over control. There’s a general trend for there to be more studies than expected with results greater than the average effect size, and there is a serious dearth of small studies (larger standard errors) with less than the average effect size. People aren’t publishing small studies with small effects, but are if they have large effects, and even large studies won’t get published if the effect is sufficiently small (or negative!). The average effect size calculated by the researchers has actually been corrected for this bias prior to the plot being drawn, which is why we can see the effect so clearly. 

      Meta-analyses usually use fairly standard methods of displaying their results, but we need another concept to make sense of them. It’s actually been here throughout the blog, lurking in the background. 

      Measuring uncertainty

      In reality, we usually don’t take multiple samples to measure our iid population, we take one. After all, we’ve decided it’s iid. So, we measure our mean, and know it’s got a standard error of σ/√N. As we’re measuring an iid population, we’re pretty confident this distribution is going to be normal, just like the population distribution we are measuring. In fact, there’s a helpful theorem, the central limit theorem, that states this will be so provided our sample is big enough, so we can prove it if we really have to. As we discussed above, we can interpret the horizontal axis of our distribution chart as measuring the probability of a particular value occurring, and therefore we can think about the distance between two values as the probability that the true value lies between them: that’s what we just did in the funnel plot. We call this distance our confidence interval, and it’s usually set to cover 95% of the distribution. Here’s how they work


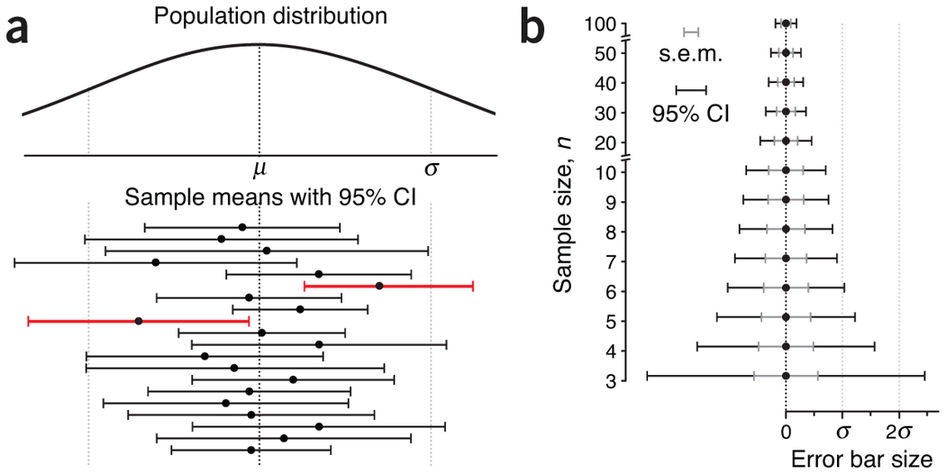
      In both the charts, our sample means are shown by dots, with their 95% confidence intervals as the lines stretching out either side, called error bars. The first chart, a, shows our not amazingly successful attempts to sample the population distribution at the top. Two of our samples, indicated in red, have 95% confidence intervals that do not cross the population mean. This has actually happened by chance, and the width of our error bars tells us we have been trying to use small samples. As we have seen above, the smaller the sample, the harder it will be to keep it iid with its parent population, particularly one as scattered as this distribution. The relationship between our confidence intervals and sample size is shown in chart b, with the widths of our error bars decreasing as the sample sizes used to estimate them increase (yes, that’s what makes the funnel in a funnel plot). 

      We can now say what meat-analysis is trying to do, and it’s gratifyingly simple. 

      Meta-analyses try to estimate both the mean and the 95% confidence interval of the treatment effect from the combined iid studies. 

      Let’s have a look at a similar plot (they’re called forest plots) from a real meta-analysis, also about homeopathy. 

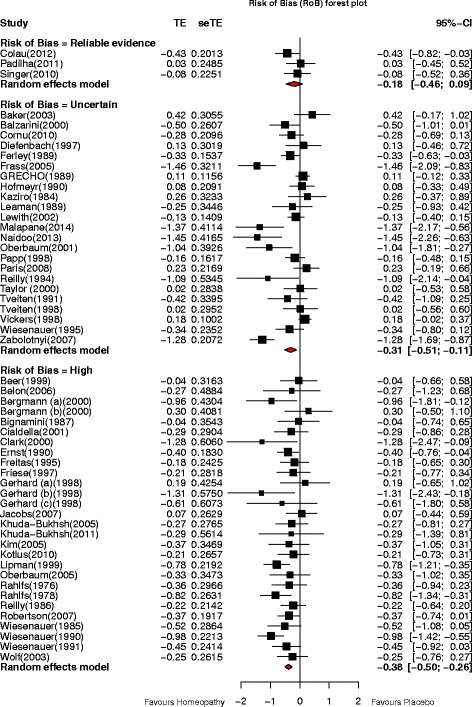
      Everything is measured in standard errors. TE=Treatment Effect, seTE=Standard Error of Treatment Effect, CI=Confidence Interval


      As shrinking error bars with sample size make smaller studies more visible, the mean treatment effects of each study have bean displayed as black squares whose area is proportional to the number in the study’s sample. The meta-analysis’ contribution is the set of three diamonds below each column of studies. The vertical points of the diamonds are aligned with the average treatment effect, while the horizontal points define its 95% confidence interval. We can see that this meta-analysis is making the same point as the previous one about homeopathy:  as our control of possible bias gets better, so the effect size reduces: we can now see that, for the best studies, we cannot be confident that there is any effect of homeopathy at all, as the top diamond crosses the “no effect” line. 

      We can now put together a set of 7 questions to help us evaluate a meta-analysis. 

      1. Is the literature search to obtain the studies likely to have got them all? (failure invites bias)
      2. Are there enough similar studies to do a convincing meta-analysis?
      3. Have the studies been adequately screened for quality?
      4. Have they described how they addressed heterogeneity?
      5. Have they addressed publication bias?
      6. How big is the average effect size?
      7. Does its standard error overlap the “no effect” line?

        As we can see, there is no guarantee a meta-analysis will always provide better treatment data than a well designed RCT. 

        Let’s start by looking at what meta-analyses can do. If we compare the results of the meta-analysis of talking therapies (effect size around 0.5) with the large non-randomised comparison of CBT and counselling discussed earlier, we can see that less than half of the overall treatment effect (1.2, remember) is down to efficacy (our definition of variance, discussed above, lets us claim things like that). That doesn’t mean the therapists should give up and go home: the non-specific effects that are doing so much to get the patients better may well be embedded in the service, and would also disappear if the service was removed. However, it does tell us that, if around half of everybody is getting better with therapy, offering even more therapy is unlikely to change things much. It also tells us that therapy should remain an option: checking our table above shows a 0.5 effect size is still valuable. 

        Now let’s think about what they can’t do. Combining studies, as we’ve just seen, can add a whole new layer of error, and lots of additional assumptions. Large, biased studies can distort their results, as can hidden studies with negative findings. Meanwhile, lots of small studies introduce noise and unpredictable extreme results, as the smaller they are, the harder it is for their comparison groups to be iid with respect to each other. Because of how meta-analysis works, these errors propagate through the calculations. This means that a meta-analysis can never equal a single well-designed RCT of equivalent size. However, very large RCTs have their own problem, like cost, so the current system of using both as appropriate seems best. In the end, they are just different ways of answering the same simple question: does giving a treatment make a measurable difference?

        Hunting the Snark: problems in defining the causes of psychiatric diagnoses 

        I’d guess that there are more contested causes to diagnosis in psychiatry than any other branch of medicine. This blog is going to argue that these challenges misinterpret the role of cause in our discipline, contribute to misunderstandings and stigma, and undermine, rather than advance, our knowledge and understanding.

        What is Cause Anyway?

        Aristotle: formidable polymath and tutor of Alexander the Great

        To see how slippery the idea of “cause” is, we need go no further than Aristotle’s famous thought experiment, to identify the cause of a statue. He came up with four

        1. The material cause is the marble the statue was made from
        2. The formal cause is the thing the statue represents
        3. The efficient cause is the sculptor who made it
        4. The final cause is the reason the statue was made

        Today, we’d probably see both the formal and material causes as characteristics instead, while the final cause is an intention. This leaves the efficient cause being closest to what we mean, though we’d probably be more comfortable saying that the sculptor made the sculpture, rather than s/he caused it. We’re already starting to find language is giving us problems, and things are about to get a lot worse.

        Hume’s limit to understanding causation

        David Hume. At the time, his ideas about cause were so revolutionary some thought he was joking

        David Hume managed to completely demolish the idea that our everyday intuition of causality had any credibility. He made two claims

        1. That causation could not be deduced by reasoning (goodbye Aristotle’s thought experiment) but was a property of things in themselves.
        2. That the reason we perceive a relationship as causal is due to our mental processes regarding the the cause and effect. All we can assert about a cause and its effect is that they occur together: it is what Hume calls “custom” (in the sense of our response to finding cause and effect together repeatedly) that leads us to infer cause and effect.

        Hume thus sets the limit to understanding causation inside our heads. We can no more see what cause and effect really is than see the continuous electromagnetic spectrum we perceive as light. For the former we rely on our sense of custom (in Hume’s words) as we rely on our three colour receptors for the latter. In taking this stance, we are effectively asserting that identifying a cause and effect relationship is identical to predicting it. As this is easier to see in relation to a rainbow, I’ll use it as an illustration


        We can detect, with some accuracy, light of wavelengths between 400 and 700  nanometres, by noticing the light’s colour. As the chart shows, this is done by us comparing the relative activation of our three colour receptor types, which are tuned to peak at different wavelengths. Our internal experience of receptor activation thus predicts the wavelength that is hitting them.  Hume proposed that we predict cause from a similar attunement to customary repetition and, just like colour, we can’t get beyond that unaided.

        Thus, the determination of cause is based on our psychological ability (augmented as required), just like our colour sense.

        Our colour analogy does allow an Aristotelian to make an objection. If our understanding of cause is like our understanding of colour, have we picked the right cause? After all, colour would be part of an object’s formal cause, which we have already dismissed as a characteristic using modern language. It is surprisingly easy to confuse formal with efficient causes, e.g., Aquinas’ argument that that the soul is the formal cause of the body is perilously close to the popular biopsychosocial model currently employed in psychiatry. However, I am going to summon Newton to show why this argument is wrong, and simultaneously offer a further way of understanding cause, which will help us enormously.

        Isaac Newton: founder of classical physics

        Let’s conduct a physics experiment. You might even have done it already.

        Newton’s cradle

        What happens is that when the raised ball strikes the others, the ball at the other end lifts off, with the movement reciprocating until friction makes it run out of steam. Even knowing no  physics, we’re happy to say that the first ball has caused the last ball to move, though we might struggle to say why. In everyday language, we’d probably say that the first ball made the last ball move. This language use is identical to that of the sculptor and the statue, so it would be perverse to deny that we are looking at efficient causation. Let’s see what happens when we try to understand the physics of what’s going on.

        At the moment the first ball (of mass m) strikes the second at velocity v, it possesses kinetic energy of

        (mv²)/2

        There are five identical balls in our cradle, so the next ball also has mass m.  At the moment of impact the the ball can be regarded as stationary (because the strike is instantaneous). It is therefore exerting a force f, because it’s been decelerated (-a) from v to zero. The magnitude of this force (according to Newton’s second law of motion) is

        f = ma

        but Newton’s third law states that “every action has an equal and opposite reaction” so the second ball exerts an equal force, -f, on the first ball. The first ball thus stops, as the two forces cancel each other out. However, there’s still the additional energy (mv²)/2 in the system. The second ball is already in contact with the third, and thus the process is repeated until the last ball is reached. At this point, as -f is absent, the energy becomes expressed as (mv²)/2 once more, and the ball swings out at initial linear velocity v.  Because of gravity, the ball returns and the whole process repeats, this time in the opposite direction.

        This account completely explains the behaviour of Newton’s cradle. However, what we have before us is a detailed description, or mathematical model of a dynamic system, which predicts the system’s behaviour. In Aristotle’s model, this would also be a formal cause!  Also, the difference between our original intuition that “the first ball makes the last ball move” and Newton’s explication is one of the degree of prediction each is capable of. I am therefore going to reframe Hume’s concept of causality as follows.

        Our understanding of a cause and effect relationship is proportional to our ability to predict the dynamic system that the cause and its effect expresses.

        We can draw three conclusions from all of this.

        1. Causality is how we experience one of our faculties, so is a matter for psychology.
        2. As it involves prediction it should be a “more or less” rather than “yes or no” faculty. However, we experience knowing the cause as “yes or no”, frequently with an added “aha!” when we come across it unexpectedly. This is not unlike our judgment of colour, when we split light into different categories of hue.
        3. Our comprehension of cause is updatable as new evidence improves our predictive abilities.

        The Psychology of Causation

        Unsurprisingly, given its importance as a tool to predict the environment, causal reasoning about events develops young, and is detectible by 24 months.

        There’s some evidence that the brain processes causation about things and people differently.


        It certainly seems to be the case that reasoning about causes in things and people shows very different psychopathology.

        Consider the following statement, taken from real life.

        A patient noticed that a ketchup bottle was stood upside down. S/he thereupon knew that the wombs of all the women in Ireland had been turned inside out.

        This is called a delusional percept, and is a symptom of psychosis. Irrespective of whether the relationship implies a cause (who knows?) it’s clear that the process of customary, predictive association we need for cause perception has completely broken down.

        The picture is rather different when we try to work out causes of human behaviour because we have a separate Theory of Mind (TOM).

        A simple test of theory of mind

        While ordinary children have no trouble saying, some children with autistic spectrum disorders struggle with this. Specifically, while they have no trouble understanding that the marble has been moved to the box, they are unable to work out that nothing has happened to change Sally’s behaviour.

        This corresponds to our everyday intuition that persons are fundamentally different from  things. Causes can have effects on both things and persons, but the kinds of causes are radically different, and denoted by different vocabularies.

        Dilbert on treating persons like things and things like persons

        Applying Causes to Psychiatric Diagnoses

        As we’ve just shown, trying to ascertain causes of psychiatric disorders begs the question: are we to identify our causes with respect to persons, or things?  This, of course, sets the stage for anti-psychiatry.

        Anti-psychiatry’s original spokesman

        Anti-psychiatry is strongly wedded to the idea that the causes of diagnosis related to our status as persons. Szasz, who considered that mental illness was a metaphor for human problems in living, tried to establish his argument by exclusion, claiming  that, outside obviously “organic” syndromes like the dementias, no biological evidence to support or refute psychiatric diagnoses exists. Essentially, he denied a difference between most psychiatric disorders and malingering, and considered psychiatry was succeeding to religion and defining our moral order. The alternative causal model was to suggest that mental illness arose out of a disjunction between individual needs and societal  constraints, and appropriate adjustments of the latter would either/or cause symptom remission, or permit successful reappraisal of the disorder as an alternative but valid way of living.

        What about treating psychiatric disorder as a thing? As long as it’s not a person, “thing” is entirely general. Even “personality”, despite the name, can be treated as no more than a collection of traits. It is the traditional approach within conventional medical psychiatry and, unlike Szasz’s claim, does not necessarily assume or require a definitive biological cause to be useful or valid, allowing cause to be approximate, to be determined later.

        Adolf Meyer, originator of the psychobiological approach to psychiatry

        Adolf Meyer called this approach psychobiology, but it implicitly included a social dimension (eg he pioneered the use of occupational therapy & child guidance) and so is equivalent to the biopsychosocial model used today.

        Our previous argument means this is actually a measurement question: which of our two causal faculties will be best at explicating causal models of psychiatric disorder? Entirely unsurprisingly, we need both, but need to be aware they model different things.  Psychiatric  disorder as a metaphor?

        Compare my screengrab of the meaning of the term with the delusional percept described above. The very fact we can deduce lots of possible, but equally unconvincing metaphors

        They’re sort of the same shape, and can gloop red stuff unexpectedly


        warns us we can’t reliably identify any sense in it.  Calling it a metaphor makes as much sense as claiming the fuzz on our TV at home is performance art, because we saw something similar once at Tate Modern. Meanwhile, the other strand of anti-psychiatry can readily be reformulated as a “strong environmentalist” position within conventional psychiatry: it’s saying we only need to understand how to change a patient’s social circumstances in order to achieve a successful outcome.

        Conversely, trying to work out how to help a patient achieve the best in life purely mechanically, without considering their self-awareness, understanding, motivation and ambitions, together with both their values and those of the society surrounding them, is doomed to failure.

        What the language of the previous paragraph illustrates is that, consistent with our model of twin causal faculties, the two are irreducible to each other.

        The causes of psychiatric diagnoses

        Having adopted Hume’s perspective on cause, it’s easy to say what causes psychiatric disorders.

        The causes of psychiatric disorders are the systems which lead to the associations between their component symptoms. 

        I agree this is rather like saying “the first ball hitting the second in Newton’s cradle makes the last one swing out.” However, even with this terribly feeble causal model, we can make some useful predictions.

        As we can reliably demonstrate these associations, Hume’s model lets us assert that a set of psychiatric diagnoses and their unknown causes are “out there”. To paraphrase a current anti-psychiatry slogan “complaints ain’t all there is” and to claim the contrary is to disappear down a solipsistic rabbit hole, never to emerge.

        Psychiatry has neither red nor blue pills, just methodology

        Next, we don’t have to be upset that our model has lots of missing pieces.  We can update our model as we go, and our sense of dissatisfaction is a useful motivator for us, but not a property of our cause-effect system. Conversely, claims by anti-psychiatrists to the effect that because a cause hasn’t been found, there isn’t one, are simply untrue. In mathematics, this is the difference between proving a problem is solvable, and finding the solution.

        Finally, it is very clear we are talking about things. Whatever causal model finally evolves to fully explain the association between mental symptoms will not be able to predict the meaning the diagnosis will have for the person. Quite simply, that’s not its job.

        We can now see where the anti-psychiatrists went wrong. They were, and are correct to insist that the practice of psychiatry included understanding patients as persons. But, they were wrong to assert that the personal order of causality was sufficient to capture all diagnostic functions.  I’ve already blogged extensively about diagnosis, so I won’t rehearse what diagnosis is and isn’t here, but diagnosis as cause is probably the least important, and certainly the most disposable of its uses.

        Consequences of the Diagnosis Wars

        Anti-psychiatry went to war over diagnosis, for ethical reasons, and also over the validity of the systems then in use.  At the time, they were right to have such concerns, and they were also right to focus on the human dimension of causality.

        This was published in 1973


        It contains a “Mental Patients’ Bill of Rights” written from a US perspective, which I reproduce below


        If we look over the 15 rights, only one, the ability to always refuse involuntary admission, remains  unmet, at least in the UK. Equally, the demands for a represented right of appeal, and freedom from discrimination, are enshrined in UK mental health and equality legislation. The fact these needed listing said how bad things were, at least in the US, when I began my medical training, and the fact these ideas are now mainstream is vindication of anti-psychiatry’s focus on human well-being and rights.  It also reflects the power and influence of the movement.

        Unfortunately, their insistence that just the human order of causality was sufficient for psychiatry has done enormous damage.

        In the UK in 1968, strongly influenced by the sociological models which also informed anti-psychiatry, the Seebohm committee recommended the replacement of separate specialist strands of social work training with a single generic qualification. Many UK Social Workers are now better trained in anti-psychiatry than psychiatry, with only the most superficial knowledge of either the disorders their clients have, or the benefits and risks of the treatments they are receiving, when they graduate. Compare the syllabus just linked to with the tasks a mental health social worker actually performs and there is a significant gap, which social worker must make up, while lack of appropriate knowledge contributes to the maintenance of stigma.

        Szasz’s equation of psychiatric patients without biological causes with malingering strips patients with medically unexplained symptoms of their dignity, and the anti-psychiatry proposal that they should receive psychosocial understanding would be met by fury.  Unfortunately, the drumbeat of insistence that psychiatric disorders require biological validation to be true has obscured the fact that they are medical diagnoses, and, like all medical diagnoses, are pragmatic, so may not have an identified biological aetiology.  The confusion that results can lead to harm from inappropriate medical attitudes, investigations, and failure to accept effective treatments because they are deemed to be presuming an unacceptable causal model.

        The final mischief I will mention relates to personality disorder.  As they are the topic of a separate post, I will not discuss what I said here, but the failure of anti-psychiatry to recognise that disorders of personality may be diagnosed as disorders has left those with this diagnosis in a dreadful position.  If they receive the diagnosis, and do not realise it does not refer to them as persons (as the anti-psychiatrists deny the possibility of this) they have to choose between stigma of being in some way a “faulty person”, or denial, leading to refusal of treatment until it becomes very difficult, or even too late.

        It is time the diagnosis wars halted.  Diagnosis has come a long way since antipsychiatry raised its objections, which in consequence are no longer valid.  Meanwhile, the harm continues.  It would be superb if anti-psychiatry repurposed itself to address the human causal order, where it has already done so much good.

        The Science Behind Modern Psychiatric Diagnosis 

        In the 1950s, diagnosis and formulation were the results of very similar processes: informed opinion from trained experts. We now know that, for diagnosis, this is simply not good enough, and a whole industry dedicated to improving diagnosis has worked to totally transform them.  This blog is about the scientific principles underpinning that effort.  

        Measurement


        Without measurement, science is impossible. If we think of psychiatric diagnosis as our effort to measure mental symptoms, the ruler analogy above suggests we have a daunting challenge. Fortunately, there are more ways of measuring than that, as shown below 

        Yes, naming something is a form of measurement! The tape measure in our first picture illustrates the strongest form of measurement, the ratio scale. It’s called this because ratios make sense e.g., 10cm is double 5cm. This is because 0cm is an absolute zero. 

        Here’s an interval scale. 


        Looks very similar to a ratio scale, doesn’t it? However, for both the Fahrenheit and Celsius scales, while it makes sense to say that 20 degrees is ten degrees cooler than 30 degrees, it makes no sense to claim that 40 degrees is twice as hot as 20 degrees. To see why, let’s use the ratio scale for temperature, degrees above absolute zero (degrees Kelvin). 40 degrees C is 313 degrees K, while 20 degrees C is 293 degrees K. On the ratio scale, they’re practically the same. 

        Ordinal, or ranking scales, means that while we can put things in order, we can’t say that the differences between them are constant 


        Simple naming does no more than define differences between things


        In this rainbow, it makes no sense to say that the colours we see are anything other than different from each other. Diagnosis is closest to this type of scaling. 

        The rainbow also shows an important issue with categories. While we might draw our rainbow with each colour clearly demarcated 


        In reality the colours fade into each other, with fuzzy boundaries. I’ll have more to say about that later, but for now just notice that, despite the fuzz, the colours are there in reality too. 

        The Curse of Dimensionality

        While dimensions have a starring role in the debates over diagnosis, the curse is actually upon statisticians, who have to manage the things. Before we begin, it’s important to realise that all measurements define dimensions. Even naming defines a dimension, albeit of a single unit with only two values. 


        The Izunt-Iz dimension, as measured by Ricky Gervais

        The problem arises as the number of dimensions needed to describe something accurately increases, as the graph below illustrates 

        “Classifier performance” means how good we are at identifying something correctly. There are no numbers on the tick-marks because the chart is entirely general: the peak could fall at any number of dimensions, though it will be lower if more dimensions are needed


        This might seem odd, as one would expect that more features would lead to better identification. Unfortunately this isn’t so

        Imagine we’ve we’re trying to pick out people with a psychiatric disorder (represented by dots inside the red shaded area) from everyone (all the dots). With the same unit of measurement for each characteristic (dimension), we can see that the number of people we can identify drops off dramatically as the number of dimensions we have to use increases. Of course, if our measure was perfect, that would be fine, but no measure is. The proportion of cases correctly identified by a measure is called its sensitivity, while the number of non-cases correctly identified is its specificity.  We call the proportion of cases in the population prevalence, our ability to identify cases in the population positive predictive value, and our ability to identify non-cases negative predictive value.  This chart shows how they relate 


        The curse of dimensionality thus means, that the more characteristics we use to describe a psychiatric disorder, the worse we will become at identifying it, if we do not at the same time dramatically improve our measurement ability. It’s therefore not surprising that complex psychosocial formulation is hopeless at this task. The goal therefore has to be to find the minimum number of characteristics that will identify a psychiatric disorder, which leads to the next section. 

        Reliability and Validity

        At its very simplest, reliability is the chance of a result being the same if it is repeated, while validity is whether the measure captures what is intended to be measured. For our purposes though, it’s better to reframe them like this. 

        • Reliability is the random error associated with a measure 
        • Validity is the bias a measure might have. 

        If we think of a measure as an attempt to hit a target, this becomes clear 

        From the observer’s perspective, a high validity/low reliability condition is as bad as a low reliability/low validity one, because we can only see the arrowheads.


        If we focus on a single measurement point (arrow) it becomes clear that a target can never be more valid than it is reliable, though it can be less valid. This means that diagnosis must first be measured in terms of its reliability, before validity can be considered. Diagnosis has used two approaches to this: prototypes and operationalised criteria. 

        A standard poodle being judged for conformance to its prototype

        Prototypes are the conventional means of identifying species in biology: a typical example is kept for comparison, which is one of the main scholarly functions of natural history museums worldwide. This system remains recommended for use in the clinical identification of psychiatric disorders in the World Health Organisation’s system 

        The alternative approach is to use “operationalised criteria”.  There is a “strong” and a “weak” version of this approach. 

        • The strong approach defines a number of criteria which have to be met, usually from a larger total set (inclusion criteria) and criteria which must not be present (exclusion criteria) together with a specified method for identifying them. 
        • The weak approach has inclusion and exclusion criteria, but does not specify a method for assessing them. 

        The strong approach is largely used for research, when it is implemented by structured interviews.  These often allow assignation to more than one diagnostic system. The weaker version is employed in the American DSM5. 


            The reliability of both systems is extensively tested before release, and a huge literature covering the reliability of their different diagnoses exists. In general, reliability using structured interviews has been found to be better, but, with care and training, both the carefully specified prototypes of ICD -10 and the inclusion/exclusion  criteria of DSM5 show sufficient reliability though, unsurprisingly, variation between different diagnoses exists. 

            Unfortunately, validity is altogether trickier than reliability because, while all validity introduces bias, there are many ways that bias can be introduced. This leads to there being several kinds of validity. 

            • Face Validity this is the best known type of validity. It simply means that the measure should seem to refer to its target. 
            • Content Validity requires a measure to cover all aspects of the target.  For example, a depression measure should include enough questions to cover all the ways depression can present. 
            • Predictive Validity requires the measure to be able to predict other characteristics of its target, not included in the measure.  These might include response to treatment, associated features, or prognosis. 
            • Criterion Validity means the measure should be able to detect some specified characteristic of its target.  For example, a depression screen should be able to recognise when there are enough symptoms to make a diagnosis. The curse of dimensionality means we want no more. 
            • Construct Validity is the extent to which the measure truly reflects the nature of the target. 
            • Convergent Validity is when the measure tracks another measure of known validity when measuring the same target. 
            • Divergent (Discriminant) Validity is when the measure gives a different result to another measure, known to measure something else, when used on the same target. 

            Which type of validity is important depends very much on the purpose of the measure. For example, it is currently thought brain imaging provides good construct validity for many disorders. However, for most of these, criterion validity has not been established, so it is not widely used for diagnosis except in a few conditions, such as dementias. 

            The prime value of a diagnosis lies in its predictive validity, because that tells us what to expect, what to prepare  for, and what treatments might work. It can be measured by correlating the measure with what it needs to predict, as this chart of different personnel assessment tools shows.   

            Predictive validity of different assessments of likely job performance

            Here’s a more immediately relevant example 

            Asterisks indicate that the correlation is significant

            I’ve chosen to use personality disorders, as these are highly contested diagnoses which I’ve blogged about before. Here, what it shows is that the association between an avoidant adult attachment style and either physical or psychological intimate partner violence is actually explained by the propensity of this attachment style to predict borderline and antisocial personality disorders. It is the presence of these two diagnoses that predict intimate partner violence, not the avoidant attachment style itself. 

            Of course, to be used, a diagnosis also needs criterion and content validity, which leads to our next section. 

            Cutting the Rainbow

            Psychiatric diagnosis has three components 

            1. A set of signs and/or symptoms, defined as above. 
            2. An abnormality criterion: the diagnostic features should be developmentally and socially unexpected. 
            3. An impairment criterion: the diagnostic features should cause harm either to the patient or others, or both.

             Avoidant adult attachment style doesn’t make the cut as a diagnosis, because, alone, it doesn’t meet either criterion 2 or 3, even though it is a risk factor, as we have just seen. However, both these criteria beg an important question. How should we set our cut-offs?  After all, it’s pretty obvious that there are going to be borderline examples of both “abnormality” and “harm”. Only a little more thought is needed to apply the same boundary question to the symptomatic criteria also. We are no longer with our convenient rainbow cartoon, but the real thing, and need to tackle its fuzziness head on. 

            Latent traits and latent classes

            The normal curve. The percentages refer to the proportion of the population in the labelled segment of the curve


            Many things in our population either follow, or can be transformed to a curve like the one above, where the unit of measurement of the thing we’re measuring is standard deviations from the mean score.  Long tradition has suggested that either a 5% or 2.5% cut-off works well in defining abnormality. If we think back to our discussion of the curse of  dimensionality, to impose such a cut-off in addition to adding the extra dimension (or two) associated with the distributions of abnormality  and impairment is pretty stringent, so if we are able to identify such a diagnosis reliably means it has passed a high bar, albeit we often cannot do more than guesstimate these. However, we can also tackle the issue directly. 

            Finding hidden categories in continuous measurement

            This model outlines how it is possible to look for hidden categories if we are using continuous measurement. Here’s an example, where the classes are distinguished by different profiles.  

            The colours simply indicate how the questions reference different disorders


             If we assume (quite reasonably) that abnormality and impairment correlate with symptom count,  then, despite using continuous measurement, we can identify four distinct classes, including a group without sufficient symptoms to meet disorder criteria. Just like our rainbow’s colours, we can find evidence of separate categories of disorder.  Here, Borderline Personality Disorder (BPD) may be distinguished from both simple and complex presentations of Post-Traumatic Stress Disorder (PTSD). 

            We can do the same trick the other way round. 

            “Indicators” can include one or more diagnoses


            In this example, the finding of a single latent trait covering both dependence and abuse led to a recommendation to combine these into a single category in DSM5. 

            Two categories (dependence and abuse) sharing a single latent trait

              To understand what’s happening with these two examples, we need to go back to why we see a rainbow the way we do. Light is, of course, a continuous electromagnetic spectrum. However, we detect this using only three detectors 


            As the diagram shows, our rainbow arises because we model the continuous spectrum by different levels of excitation of these three receptor types. This is effectively a kind of latent trait analysis. Conversely, neuronal measurement of different receptors allows us to deduce the latent classes also present in our rainbow, as well as precisely modelling the wavelength they receive. Even though the receptors represent latent classes, when combined they provide enough predictive validity to let us model the entire spectrum of visual light. In diagnosis we have begun to do something similar, with increasing use of the concept of comorbidity, while the term “spectrum” is now formally applied to autistic disorders in DSM5. Unlike the rainbow, in diagnosis we frequently cannot be sure whether dimensions or categories have better construct validity. However, as our primary goal is to establish predictive validity, the science allows us to see that diagnostic categories and dimensions (with cut-offs) may be interchanged, so our modelling may be fit for the purpose we intend. 

            We can also say that the diagnoses we now use are no longer expert guesstimates, but reliable and valid categories that are backed by good science.  They will continue to evolve as our ability to measure mental symptoms improves.  


            In Defence of the Medical Model in Psychiatry 

            The Medical Zombie

            Even zombies stop for a selfie


            To listen to most commentators, the medical model lumbers around the mental health landscape like some kind of zombie. It’s dead (or at least out of date), bits of it are always being refuted, we should run screaming when it appears, and if we let it, it will eat our brains, leaving us mindless husks. Even philosophers, who should know better, criticise it in passing without clearly saying what it is, leaving us to guess its evil dimensions from their own prose about what needs changing. 

            The Medical model is usually defined by contrast with something better


            So, this post is going to introduce us to the medical model as it really is. We shall see that it is nothing like what the negative accounts suggest: indeed, many of the “improvements” suggested are actually parts of the model. But, before I say what it is, I need to make clear what it isn’t, which is unfortunately how most commentators treat it. 

            The Medical Model isn’t a Concept

            Think back to when you learned to drive a car (or if you never have, imagine it). The instructor tells you to put your hands here, your feet there, pull this lever in this direction, adjust your feet on these pedals like so, and you’re moving. What you have learned is a procedure, and a procedure is profoundly different from a concept. 

            A centipede discovering the difference between concepts and procedures

            Students learn medicine the way we learn to drive cars.  Our examinations, diagnoses and treatments are expressions of these processes. The brain encodes processes so differently from concepts that we give different terms to the memory systems used to store them.

            The many kinds of memory

            Concepts end up in explicit memory, while procedures are stored in implicit memory. To understand the difference, think back to the car driving example. Your explicit memory could probably have told you what you needed to know about the controls almost immediately. However, it took weeks of practice before your implicit memory could reproduce the necessary movements sufficiently reliably for you to pass a test.

            The Medical Model: everything above the water is concept, everything below is procedure. The ship is full of philosophers

            This is of course why all branches of medicine, including psychiatry, have practical as well as theoretical examination. So, criticisms of the medical model on theoretical (i.e., conceptual) grounds are missing what the medical model is about. 

            The Medical Model is a Skill-Set

            Precisely because skills involve procedures, they can be hard to define. The best definition I could find for our purposes turned up in, perhaps unsurprisingly, in a dictionary of business terms 

            The basic medical skills

            After diagnostic skills, which, as I discuss in another blog post, date back to ancient Egypt, practice skills are the oldest component of the medical model. They were first set out in the  famous oath, entirely incorrectly attributed to Hippocrates (to give it added force) sometime between the fifth and fourth century BCE. 


            Despite the religious preamble, it’s obvious that we’re looking at a contract. The doctor has committed s/himself to practice in certain specific ways. Ethics are an integral part, but by no means all, of what the Oath covers. 

            The first paragraph, by far the longest, commits the novice practitioner to support and help maintain his teacher’s practice. 

            The second promises, to “use diets” reflects the practice of medicine at the time: diet (which actually referred to a combination of recommended food, exercise and sexual activity) was the preferred intervention, to be adjusted according to the patient’s state of health. Ancient Greek medicine had a spectrum between drugs and food so this recommendation did not exclude the use of drugs as part of a therapeutic regimen. “Injustice” here refers to the doctor’s own judgment, so this is a guarantee of quality (which would of course also reflect favourably on the trainer). 

            The third paragraph says a lot about time-specific ethics (clearly abortifacients were as controversial then as now) but there is a key ethical guarantee: a doctor may not provide what is asked for, if it is harmful. There is also a general requirement for good ethical standards

            The fourth paragraph promises not to claim untrained expertise, even if the problem is understood and the need is urgent. Procedural knowledge trumps conceptual knowledge. 

            The final two paragraphs introduce the ideas of sexual continence and confidentiality in relation to practice. 

            Updating the language and, mutatis mutandis, the skills’ descriptions, we can now define the basic skill-set of the Medical Model

            1. When practising, a doctor must deploy s/his best training to s/his best ability 
            2. A doctor must act according to s/his best judgment, to optimise the benefit/harm ratio for the patient. 
            3. A doctor may not act on requests that, in the doctor’s estimation, will hurt s/his patients. 
            4. A doctor will not do things s/he cannot do in practice, even if s/he understands the theory, so will have a good understanding of the limitations of s/his skills. 
            5. A doctor must regulate s/his own behaviour  to exclude sexual relationships with patients, ensure confidentiality, and live to high ethical standards.  

            Having set this out, what is so surprising is the longevity of the model. These principles, with some additions, still remain at the heart of modern medical practice, and remain standards doctors are judged by. Psychiatry is a branch of medicine, and the doctors who practice it, called psychiatrists, must adapt this basic skill-set to the needs of their patients. 

            Applying the Medical Model’s Skill-Set to Psychiatry

            The first rule of adapting the model is that the basic rules haven’t changed. As we no longer live in Ancient Greece, let’s switch to the up-to-date version. The British General Medical Council captures it under four headings. 

            1. Knowledge, skills and performance 
            2. Safety and quality 
            3. Communication partnership & teamwork 
            4. Maintaining trust 

            We can see that what’s changed since Ancient Greece is mostly under heading 3, where stuff like teamwork and openness sit, consistent with our much more democratic and complex society. These days, consent, not mentioned in the Oath (as the arrangement was commercial, consent was implied), is under 4. 

            The first thing to notice is how general the model is, regarding the range of knowledge and skills it can use. If a profound knowledge of literature, or the ability to dance superbly, improved our patients’ conditions, then we would be expected to have those skills. However, the model does expect us to be judicious and competent, which are pre-requisites for trust, safety and quality. What does this mean in psychiatry?

            Judgment

            Not all judgment in medicine is medical


            Judgment is possibly the most important of all our medical skills. It is nothing to do with justice, but refers to our ability to make distinctions, so we can do different things to help our patients under different conditions. This is what diagnosis is for, as it has been since Ancient Egypt.  I have already blogged about how doctors use diagnosis, and that it may be used differently by  other professions, so all I will say here is that diagnoses work as aids to our medical judgment. Provided the judgments reliably lead to ways in which we can help our patients, the Medical Model is entirely agnostic on how true they are.  However, the medical ability to diagnose is a procedure, which takes years to acquire. Without that procedural knowledge, which is what leads to treatment choices and prognostic judgments, our understanding of the meaning of diagnosis is incomplete. It is important that psychiatric diagnoses are not completely based in language, as they may refer to conditions that may not be appropriately described linguistically: a label may be the best we can do with words. We can see that, from this perspective, that is nothing reductive or restrictive in the use of diagnosis: if the current one doesn’t fit, we can change it or develop a new one, provided we are competent to do so.

            Competence

            I guess we can think of competence as a kind of meta-skill: it says how good we are at the skills we claim. What are psychiatrists expected to be competent at?

            One thing that makes the Medical Model medical is the centrality of good ethical practice. Like everything else, moral behaviour is something we need to learn, and psychiatric ethics presents us with some of the most challenging problems in all of medicine. Psychiatry therefore explicitly includes lifelong ethical training, which is both elaborately systematised and constantly developing. This is consistent with research findings suggesting psychiatrists are at low risk for malpractice claims, compared to other medical specialities. The good ethical care psychiatrists give their patient arises directly out of the Medical Model’s requirement that ethical skills should not be distinguished from technical skills, combined with recognition of the special ethical problems that psychiatry presents over issues such as consent, meaning a higher level of ethical competence is necessary. 

            Of course, psychiatrists need technical skills too. These can be broadly divided into 

            1. Assessment skills. These come into play as soon as patients are referred or seen, and are required throughout the psychiatrist’s involvement. Diagnostic skills are probably the best-known of  these, but are by no means the only ones, as the psychiatrist must also assess how the diagnosis affects the patient’s life, what the impact of different treatments is likely to be, and how the patient responds. Without all these assessments the psychiatrist cannot know that the benefit/harm ratio (there is no such thing as a risk-free treatment) is correct. 
            2. Treatment skills. A psychiatrist must be capable of selecting the best treatment (which might be none at all); providing, either directly or indirectly, the recommended treatment or the best available, and adjusting or changing it according to the patient’s changing needs.
            3. Boundary skills. These are rarely mentioned, but are crucial for identifying when the limitations of the psychiatrist’s expertise are reached. An example might be the ability to recognise a psychiatric presentation of a physical disorder.  

            Notice that the model says nothing about what assessments or treatments should be used: the constraints arise from the requirement for competence, as we are clearly being incompetent if we choose an inappropriate treatment or assessment. 

            By now, it should be obvious that saying things like “the medical model is excessively biological”, “the medical model puts people in boxes”  or their various less flattering synonyms is paying attention to only those parts of the model that are visible as concepts, without also reflecting on the procedures which engage them, without which they cannot properly be understood. It’s time to join the dots.

            Working with a Living Fossil


            The Medical Model is very old, probably much older than the Oath we used as its starting point. Even that recently, concepts weren’t abstracted the way they are now. 

            Virtues are descriptors of people, so directly observable, not deduced concepts


            What they did understand was tools, and so medicine, of course, has always used tools. We have no problem recognising surgical tools


            But here’s a picture of a modern psychiatric tool 


            which, like any good tool, is subject to redesign and improvement over time. Of course, tools are only one part of a system, which requires skill to use properly 


            As the image above suggests, we are back to my first blog, which is about how to use our tools to do the job we intend. 

            Another tool is even more important 

            The Literature, before it went digital

             If we refer back to the Oath, we can see  that, once we have faithfully followed its precepts, we are not supposed to modify our therapeutic stance for harmful requests. These days, it’s more about effective communication and teamwork, as the GMC mentions in its third principle. That, however, does not relieve us of our duty to ensure we are indeed doing our best with our training for our patients. Evidence is the tool we should use to convince both ourselves and our colleagues: this is especially important if our approach is contested. This is not just theory: psychiatric services typically use evidence in  practice, to a similar degree to physical medicine, where the use of the medical model is uncontested. Also, despite the handicap of poorer understanding of many psychiatric disorders, psychiatric drug treatment stands comparison with many accepted drug treatments for physical conditions. This does not preclude the use of non-physical treatments either instead, or in addition to the drug treatment I’ve just discussed. Interrogation of the literature for clinical use is also a skill, demanding additional training.

            So, from inside the medical model, diagnosis, the various explanatory models of disorders, treatments, their choices and the evidence which supports them all, are simply tools to be used for the benefit of our patients. This of course does not mean that any idea or action is as good as any other, for without corroborative evidence these are no more than engaging stories or possibilities that cannot offer guidance. It is embedded in empiricism, not  theory, and has been so for 3,600 years

            Using Tools Without Training

            People who aren’t surgeons generally don’t buy scalpels. Psychologists jealously guard access to many of their tests, for fear of misuse. However, many psychiatric scales, and the core diagnostic manuals, are “out there”, to be used by whoever picks them up. If an untrained person picks up a scalpel, it will still cut, just as an IQ test will provide a score, and a diagnostic manual may offer a diagnosis. But, the outcome can be as different as using amphetamine as a drug of  abuse, and as a treatment for ADHD. 

            What could possibly go wrong?

             So, without the procedural knowledge to employ them correctly, it is easy to raise concerns about how the tools of the medical model might be misused, or unwittingly misuse them oneself. Suspicion and mistrust are likely to follow, as the outcomes do not live up to expectations, and, unlike concepts, it can be hard to know what is not understood. Before you started to learn to drive, could you understand why it would be so hard?

            What are psychiatrists for?

            A psychiatrist isn’t there to “give a diagnosis”, though you might get one. They aren’t there to “offer medication”, though that might happen. They aren’t there to promote a “biological model” however you conceive it, though they may offer one as an explanation. A psychiatrist is there to do the same as any doctor since as far back as history can remember: use the medical model for your benefit. We have now seen that is honestly and fearlessly exercising their skills and knowledge on your behalf, if necessary in collaboration with others, and without ideological limitation. It might be incredibly old, but I don’t think it’s reached its sell-by date yet. 

            Personality and its Disorders 

            For those who find the image below distressing, I’ve explained my choice at the end. 


            Last winter, I had to diagnose a young woman with an eating disorder as also having a Borderline Personality Disorder (aka Emotionally Unstable Personality Disorder). A capable researcher, she had googled her own symptoms, so was unsurprised, but despairing. By the time we had discussed current views in treatment and prognosis, we both had tears of relief in our eyes; hers because my take on her diagnosis gave new hope of recovery, mine because I was able to overcome the incorrect stigma the diagnosis carries. This blog is about trying to strip that stigma from these unfortunately named diagnoses, so that they can be used better. 

            Personality as Our Soul


            Almost no-one reared in a Christian environment will have trouble interpreting this image: folks struggling to get to heaven, encouraged by angels and saints, but some being dragged to their doom by pesky demons. We know they’re not people’s physical bodies, but souls, as they look the same at the top of the ladder (heaven) as they do at the bottom (earth): there is no sign of them leaving a physical body. We also know that the demons are being fair in their choices and actions. or the saints and angels, let alone Jesus, would be intervening. When we look at the souls, we can see that they still have the characteristics and identities of the living people they once were. Though other faiths take different views, the Christian conception of the soul is thus very similar to our everyday understanding of personality. In Western philosophy, personality was a metaphysical concept, synonymous with moral character, which only recently acquired an empirical dimension. This concept can also be found in law, with new offenders having been said to have “lost their good character”, which in turn affects their ability to access certain societal benefits, e.g., it can bar immigration, and restrict jury service. I am therefore going to suggest a rather strange everyday interpretation of personality, which will however be very useful in understanding why “personality disorder” gets under so many people’s skins, and which I think captures the moral nuances of the term.  

            Personality encompasses those aspects of ourselves about which we make moral judgments

            From this perspective, a diagnosis of  “personality disorder” carries within it a potential negative moral judgment. 

            Personality as a psychological construct.

             Let’s now take a different perspective and definition. Here’s the currently agreed psychological one 

            Personality refers to individual differences in characteristic patterns of thinking, feeling and behaving. The study of personality focuses on two broad areas: One is understanding individual differences in particular personality characteristics, such as sociability or irritability. The other is understanding how the various parts of a person come together as a whole.

            Our technical definition has completely removed the ethical dimension apparent in our everyday approach. Instead of our personalities being something metaphysical, they are simply either a class of individual differences, or an estimate of how our various characteristics integrate with each other. This makes personality disorders no more than a subset of all psychiatric disorders, referring to some disabling disturbance in these characteristics. 

            However, despite these differences, both definitions have the potential to overlap upon at least some of the same qualities. For example, “trustworthiness” is a quality on which individuals may differ, and which has a clear moral valence. 

            Where we go from here depends very much on the assumptions we make on mind and brain. If we assume that the mind is in some way non-physical, then we have no difficulty: we simply assert that the ethical dimension of personality belongs to the non-physical part of mind, and is separable from psychiatric disorders, which reflect brain disturbance. Of course, that gives us other problems, which I’ve discussed in a previous blog post on this site. 

            If however, we do accept that mind is simply how the brain organises part of itself, then we have to admit the possibility of psychiatric disorders existing which will attract negative moral judgments, even though we agree that psychiatric disorder should not be subject to such judgments. It follows that this is exactly the cleft stick we find ourselves in with personality disorders. 

            Personality Disorders as Psychiatric Diagnoses which Attract Negative Ethical Evaluations

            It was not so long ago that all psychiatric disorders were morally connoted. The combination of early developments in genetics with hybrid terms such as “degeneracy” (implying both physical and moral decay within or across the generations) led to possibly the worst ever failure of the medical model: eugenics, which still casts its shadow over biological theories of mental illness. 

            Why eugenics is a bad thing: Nazi-style ideology in Oregon in the 1920s

            We now know that eugenics was genetically as well as morally misguided, but does that mean that there are no biological failures of “moral character”?  

            The strange story of gambling. 

            Curiously, for so enduring a vice, gambling (unlike greed) isn’t mentioned in the Christian Bible, though it does make it into the Koran. Excessive indulgence in it has been correctly associated with the complete destruction of family fortunes 

            The 7th Duke of Leinster, who gambled away the fortune of one of Ireland’s wealthiest families

            Historically, it has also been associated with companion vices of promiscuity and intoxication, making it a fine topic for instructive paintings

            However, there is another side to this story. 

            Parkinson’s disease is a neurological condition, named after the doctor who first described it, which induces tremor, interferes with movement, and can impose mental, as well as physical inflexibility, with dementia as a severe consequence.

            Its mechanism is reasonably well understood 

            Insufficient dopamine produced by the substantia nigra

            and it’s long been treated, with some success, with drugs that increase dopamine levels, most famously dopamine’s metabolic precursor, L-DOPA (called levodopa when prescribed). 

            If we look on its list of side effects, we find 

            Drug induced moral turpitude?

             It turns out that dopamine does more than let us move properly. It also is the major neurotransmitter for the brain’s reward system, amongst much else. 

            ACC Anterior Cingulate Cortex; PFC Prefrontal Cortex; NAcc Nucleus Accumbens; HC Hippocampal Complex; VTA Ventral Tegmental Area


             The key bit that concerns us here is the Nucleus Accumbens, falsely called the brain’s “pleasure centre”; it’s probably better described as the brain’s encouragement centre. The relationship between it and dopamine can be summed up as

            Anything that puts up dopamine in the Nucleus Accumbens is something we want to do more of, and the more we do it the more dopamine levels there will rise. 

            To show this, here’s what happens to our brains when we gamble 

            Yellow indicates raised dopamine levels

            If we compare this picture with the map of the dopamine system above, we can see the Nucleus Accumbens is highlighted. The L-DOPA story shows that the same relationship can also work in the opposite direction. It’s also been found that the effect occurs when particular genes encoding a particular type of dopamine receptor DRD4 is present. These last two studies were not done on folk with pathological gambling. so we are talking about ordinary genetic variation in ordinary brains.  Our worst fears are realised: moral behaviour is just as dependent on brain states as anything else we do. If so, then impaired mental health could disrupt our moral functioning, and not just as a result of being cut off from reality. 

            Mental health and moral responsibility in society 

            Our everyday notion of moral responsibility assumes freedom of will, and the latter seems necessary for retributive justice. However, brain states are about anatomy and biochemistry: things determined and irrelevant to “will”.   One could argue that this, as much as religion, has encouraged a dualist approach to mind: our brain is the horse, but we are the rider, and while it might throw us from time to time, we are still responsible for what we make it do. 

            The exercise of will against inclination

            This lets us try to judge whether the brain has thrown its rider, or whether the unacceptable conduct was the rider’s decision.  However, as we have already assumed that states of mind are no more than expressions of brain states, we have to reject this as a convenient fiction. 

            Fortunately, we don’t have to mire ourselves in the intricacies of the relationship between moral responsibility and freedom of will. Instead, we may simply claim that it wouldn’t be fair to treat differently functioning brains the same way. If we build on my previous blog about brain-mind identity, and assume that diagnoses are imperfect but useful indicators of systematic and impairing differences in brain function, then diagnosis may be used to guide us.  

            Let’s start with our formal statement of the identity hypothesis, as developed in that blog.  

            “For every state of mind (∀M), any individual state (Mi) can be mapped to a particular state of brain (Bi), contingent on that brain’s characteristics (Vi)” 

            In symbols, we write 

            ∀M(Mi ≡ Bi) | Vi

            Let us assume, with English law, that criminal (or vicious, it doesn’t matter which in this context) requires both an evil intention and its related action. All our vicious and evil intentions (let’s call them wicked)  {W} are part of {M}, so, allowing someone to be anything up to totally vicious and evil  {W} ⊆ {M}.  Furthermore, our definition allows us to assert that a wicked intention includes the wicked action in terms of brain states, otherwise it wouldn’t have been wicked (because we would have rejected it and done something different). This enables is to write, for a wicked intention/action

            Wi ≡ Bi | Vi

            Remember, Vi is the relevant brain condition i.e., the brain organisation that makes Bi possible It therefore follows that {Vi} includes the brain state associated with any relevant diagnoses {Δi} which in symbols is {Δi} ⊆ {Vi}. Also, the relationship between Vi and Bi is one of conditionality, not causality.

            Unfortunately, neither Vi nor Δi are directly accessible to us, so we have to make do with the admittedly imperfect proxy of descriptive diagnosis itself Di.  Because it’s the best we have, we write 

            Wi ≅ Bi | Di

            This means that no diagnosis can be held to cause a wicked act. To see the implications of this in action, let’s look at something that used to be thought wicked, but is now more accepted: suicide. People may choose to take their own life for a range of reasons: we also know that suicidal intent is one of the most dangerous symptoms of depression.  However, it makes no sense to claim that what we normally understand an intention to be can also be a symptom, as a symptom is no more than an expression of a pathological brain state. It would be like saying that snow or interference in the picture of a badly tuned TV was part of the programme. 

            Part of the picture, but not the programme: how symptoms affect our states of mind

            This means that, if we decide someone’s suicidal intent is a symptom of depression, it is pointless to debate whether they “really want” to do it, any more than someone “really wants” to have a headache.  It’s there in the same way that the headache is.  As wickedness requires both act and intention, we can assert that the suicide was a fatal outcome of depression’s brain state,  so not wicked, irrespective of our views of suicide otherwise. Why have I said “outcome” and not simply claimed that depression caused suicide? Because it hasn’t, as our symbol-writing has shown. The correct term for what’s happened is called “moderation”, as I’ve explained in a previous post on this site.  Let’s look at what all this means for how we should treat people with psychiatric disorders in general, because that’s what we’re discussing right now.  

            1.  people should be held to account for Wi ≡ Bi.  
            2. How they should be held to account should be influenced by Di.

            This seems to fit comfortably with current approaches to forensic mental health, so is unlikely to be far wrong. 

            What our model has also shown is that, once we accept the admittedly uncomfortable idea that our ethics simply reflect a set of brain states (which we possess for excellent reasons) and can therefore become disordered like any other brain state: – 

            1. There are no grounds for awarding a different moral status to those with personality disorders, from those with any other disorder. 
            2. Equally, the nature of the cause of the disorder, be it trauma, deprivation or genetic variability, makes no difference to disorder’s moral status, because no disorder can have one. 

            Some may well recognise this as being one way of stating the principle of Parity of Esteem.  As the brain is an organ of the body, we should no more morally evaluate disorders of the brain than disorders of the liver. 

            Understanding the symptoms and signs of personality disorder

            Let’s see what happens if we try to make sense of personality disorders as just another kind of psychiatric disorder.

            Currently, personality is described in terms of 5 overarching qualities, easily remembered if we use the acronym OCEAN

            1. Openness 
            2. Conscientious
            3. Extraversion 
            4. Agreeableness 
            5. Neuroticism 

            Correlating personality disorders with personality dimensions

            As the table above shows, though there is inevitably some variation, the various  personality disorders have been shown to relate to the various dimensions of personality across a large number of studies. So, calling them all “personality disorders” isn’t too bad a description. However, it’s important not to overinterpret what this means.  Here’s a picture illustrating how even the strongest associations reported in the table are pretty fuzzy.  

            Visual representation of strength of association between variables reported as correlations

            Also, conditions that are not classed as personality disorders may be associated with the dimensions, e.g.,  anxiety disorders and Neuroticism. It might be better to understand them as (among others) “disorders which affect personality”, particularly if we wish to remind ourselves that we are wanting to denote brain-states. 

            However, as I’ve argued previously on this site, the value of diagnoses for clinicians and patients lies in their predictive validity, which is how good they are at letting us know what to expect from them, and what will best work to ameliorate their impact.

            Borderline Personality Disorder is a good example to take. I’ve already mentioned it can be successfully treated in the introduction.  Here are its symptoms 


            No-one wants to go through life in that way, so being able to reliably identify it, and thereby discover what’s needed to prevent it as well as treat it, would be good. In fact, it can be identified very reliably indeed, and its epidemiology can be explored like any other psychiatric disorder; nothing special is required. 

            We can also go a bit further, and visualise some of Δi.

            Meta analysis of differences in amount of grey matter HC = Healthy Controls BPD = Borderline Personality Disorder


            For BPD at least, our model fits, and this is the commonest personality disorder presenting in psychiatric clinics. 

            Denial of Personality Disorder is Unethical

            Not so long ago, we thought that the best way to stamp out racism was to become “colour-blind” and simply enforce a rule that black skin tones meant nothing. We found it didn’t work. 

            • Thanks to previous discrimination, black people had inequality of access to qualifying characteristics for rewarding roles in Western society. 
            • Black skin tone reflected a different cultural identity & different physical needs, from haircare to health risks, none of which could be accommodated in a colour-blind approach. 

            The denial of personality disorder as a diagnosis has identical effects to the colour-blind approach to racism, and does at least as much harm. 

            Let’s do the theory first. Personality Disorders are simply a subset of {Di},  which means, conditional upon the diagnosis. their symptoms shouldn’t be subject to moral censure. However, we have already seen that, in the everyday theory of personality, their symptoms are exactly those characteristics which are likely to lead to moral judgments. So, in the absence of a diagnosis, we will assume that the person is culpable in the same way as anyone else, which we have already argued is unfair. 

            Instead of being symptoms, the overweening arrogance of narcissistic personality disorder, the dependency and unreliable emotional expression of BPD, and the aggression of antisocial personality disorder become invalidating moral defects, leading us to avoid, criticise or punish the sufferer, rather than helping them overcome their disorder. Sadly, this view also holds away amongst some ill-informed (and sometimes would-be) professionals, included in the view that “personality disorder isn’t a psychiatric disorder”. For example, it is currently fashionable among some psychiatrists and psychologists to claim that President Donald Trump has a narcissistic personality disorder. However, it is clear that this is deliberately using the stigmatising power of the term for political ends. This abuse arises precisely because these psychiatrists and psychologists are blurring the distinction between everyday and technical definitions of personality and its disorders, so hiding the distinction between the brain state associated with narcissistic personality disorder Δi, and his inflammatory pronouncements (Wi ⊂ Mi) ≡ Bi. This is not a diagnosis, but an insult: the diagnosis is being recruited as a synonym for ordinary wickedness, and its separate validity denied in consequence.  This is also why proper assessment (which was not conducted by Trump’s  accusers) is essential for all psychiatric disorders; it is what lets us distinguish between Mi (or Wi) and Di in the first place 

            Would these make you more or less likely to seek help?


            While little research has been done, narcissistic personality disorder sufferers make significantly more lethal suicide attempts than other personality disorders, and are also amenable to treatment, though research is also more scarce than for BPD. From this perspective, if they’re right, the accusatory clinicians are (probably minimally) harming rather than improving Donald Trump’s life expectancy and quality of life. Far worse is the barrier this creates for those who suspect they might have this, and take the attack to reflect how professionals might treat them.  As the two images above show, they may very well be right. Under these conditions, it is understandable that service users with personality disorders may eschew and ridicule these diagnoses. However, they may unwittingly be helping to perpetuating the very prejudice they are trying to fight against, and make it harder to get help which can literally be life-saving, for themselves and others. 

            I have always taught my students that the  nature of psychiatric disorders means that they can be hard to be with. This is especially true of the personality disorders, and is one of the reasons they can be so hard to treat. However, we have seen that we have no ethical reason to judge folks with personality disorders more harshly than those with any other kind of psychiatric disorder, and failing to recognise and treat them as psychiatric disorders makes us more likely to do so. 

            Why “Silence of the Lambs”

            Since the blog was published, I’ve had several comments arguing that this image was both distressing, and maintained the very stigma this blog post opposes.  I’ve removed it from the title screen, but have kept it as my initial image, setting out my reasons for choosing it, rather than simply replacing it with something more inoffensive. 

            1. As you’ll have realised if you’ve read this far, this blog is about all personality disorders, and that is the everyday perception of them. Though fictitious, Hannibal Lecter challenges us to realise that he has a psychiatric disorder, and it isn’t always easy to find it in ourselves to accept that those as bad as he need help as well as punishment. The alternative is to talk of “better” and “worse” personality disorders in moral terms, and if you’ve followed my argument that would never do. 
            2. Hannibal Lecter is also a psychiatrist. The idea of the deadly, dangerous amoral psychiatrist who sacrifices people for knowledge continues be fed to us in the media, and sadly reflects social contagion from these patients, who we do our best to treat. 
            3. In the picture, Hannibal Lecter is restrained.  No-one who commented to me has mentioned the level of restraint, but it is outrageous. It brings home how much training is actually needed to treat this class of patient humanely. The film itself flags the inhumanity of his confinement, when untrained staff were in charge, but, for someone with a personality disorder, we read it as a sign of what he needs or deserves, rather than cruelty towards him.  It is high time our attitude changed.