In the 1950s, diagnosis and formulation were the results of very similar processes: informed opinion from trained experts. We now know that, for diagnosis, this is simply not good enough, and a whole industry dedicated to improving diagnosis has worked to totally transform them. This blog is about the scientific principles underpinning that effort.
Measurement
Without measurement, science is impossible. If we think of psychiatric diagnosis as our effort to measure mental symptoms, the ruler analogy above suggests we have a daunting challenge. Fortunately, there are more ways of measuring than that, as shown below
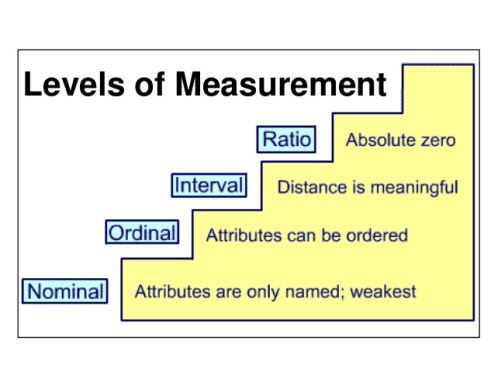
Yes, naming something is a form of measurement! The tape measure in our first picture illustrates the strongest form of measurement, the ratio scale. It’s called this because ratios make sense e.g., 10cm is double 5cm. This is because 0cm is an absolute zero.
Here’s an interval scale.
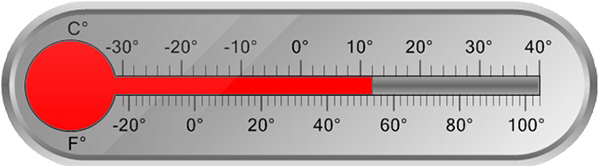
Looks very similar to a ratio scale, doesn’t it? However, for both the Fahrenheit and Celsius scales, while it makes sense to say that 20 degrees is ten degrees cooler than 30 degrees, it makes no sense to claim that 40 degrees is twice as hot as 20 degrees. To see why, let’s use the ratio scale for temperature, degrees above absolute zero (degrees Kelvin). 40 degrees C is 313 degrees K, while 20 degrees C is 293 degrees K. On the ratio scale, they’re practically the same.
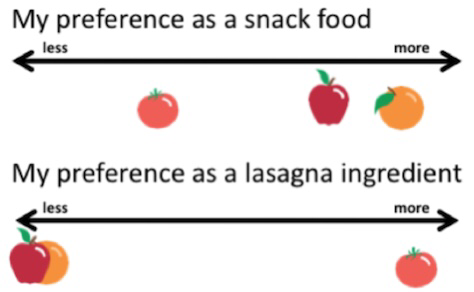
Ordinal, or ranking scales, means that while we can put things in order, we can’t say that the differences between them are constant
Simple naming does no more than define differences between things

In this rainbow, it makes no sense to say that the colours we see are anything other than different from each other. Diagnosis is closest to this type of scaling.
The rainbow also shows an important issue with categories. While we might draw our rainbow with each colour clearly demarcated

In reality the colours fade into each other, with fuzzy boundaries. I’ll have more to say about that later, but for now just notice that, despite the fuzz, the colours are there in reality too.
The Curse of Dimensionality
While dimensions have a starring role in the debates over diagnosis, the curse is actually upon statisticians, who have to manage the things. Before we begin, it’s important to realise that all measurements define dimensions. Even naming defines a dimension, albeit of a single unit with only two values.
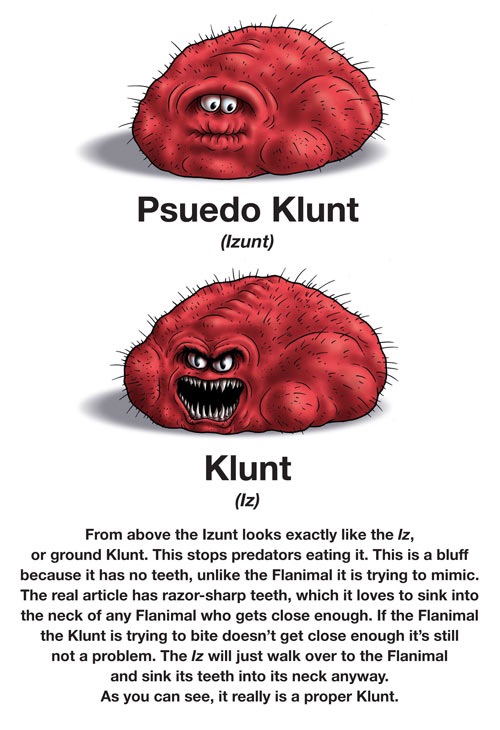
The Izunt-Iz dimension, as measured by Ricky Gervais
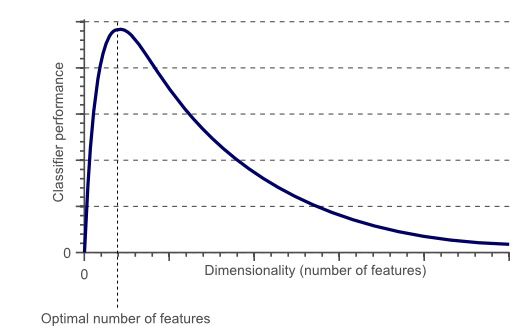
“Classifier performance” means how good we are at identifying something correctly. There are no numbers on the tick-marks because the chart is entirely general: the peak could fall at any number of dimensions, though it will be lower if more dimensions are needed
This might seem odd, as one would expect that more features would lead to better identification. Unfortunately this isn’t so
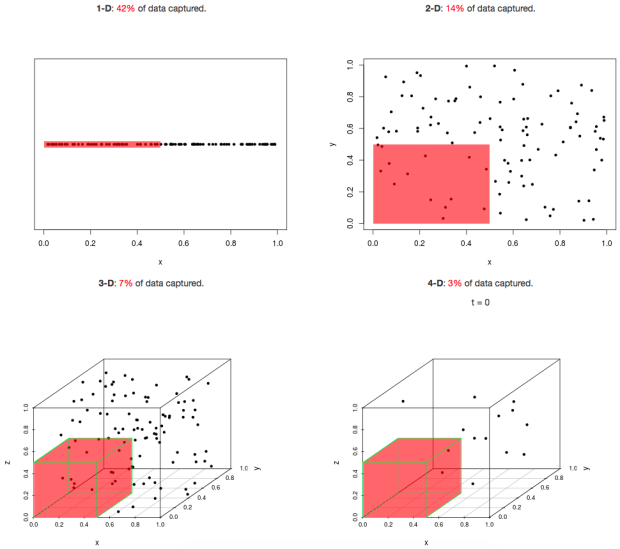 Imagine we’ve we’re trying to pick out people with a psychiatric disorder (represented by dots inside the red shaded area) from everyone (all the dots). With the same unit of measurement for each characteristic (dimension), we can see that the number of people we can identify drops off dramatically as the number of dimensions we have to use increases. Of course, if our measure was perfect, that would be fine, but no measure is. The proportion of cases correctly identified by a measure is called its sensitivity, while the number of non-cases correctly identified is its specificity. We call the proportion of cases in the population prevalence, our ability to identify cases in the population positive predictive value, and our ability to identify non-cases negative predictive value. This chart shows how they relate

The curse of dimensionality thus means, that the more characteristics we use to describe a psychiatric disorder, the worse we will become at identifying it, if we do not at the same time dramatically improve our measurement ability. It’s therefore not surprising that complex psychosocial formulation is hopeless at this task. The goal therefore has to be to find the minimum number of characteristics that will identify a psychiatric disorder, which leads to the next section.
Reliability and Validity
At its very simplest, reliability is the chance of a result being the same if it is repeated, while validity is whether the measure captures what is intended to be measured. For our purposes though, it’s better to reframe them like this.
- Reliability is the random error associated with a measure
- Validity is the bias a measure might have.
If we think of a measure as an attempt to hit a target, this becomes clear

From the observer’s perspective, a high validity/low reliability condition is as bad as a low reliability/low validity one, because we can only see the arrowheads.
If we focus on a single measurement point (arrow) it becomes clear that a target can never be more valid than it is reliable, though it can be less valid. This means that diagnosis must first be measured in terms of its reliability, before validity can be considered. Diagnosis has used two approaches to this: prototypes and operationalised criteria.
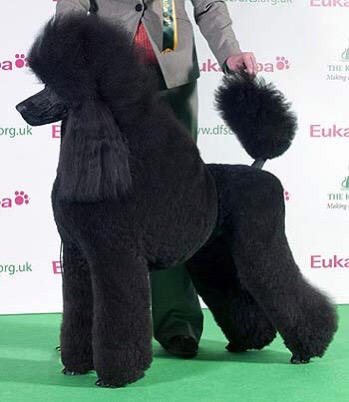
A standard poodle being judged for conformance to its prototype
The alternative approach is to use “operationalised criteria”. There is a “strong” and a “weak” version of this approach.
- The strong approach defines a number of criteria which have to be met, usually from a larger total set (inclusion criteria) and criteria which must not be present (exclusion criteria) together with a specified method for identifying them.
- The weak approach has inclusion and exclusion criteria, but does not specify a method for assessing them.
The strong approach is largely used for research, when it is implemented by structured interviews. These often allow assignation to more than one diagnostic system. The weaker version is employed in the American DSM5.

The reliability of both systems is extensively tested before release, and a huge literature covering the reliability of their different diagnoses exists. In general, reliability using structured interviews has been found to be better, but, with care and training, both the carefully specified prototypes of ICD -10 and the inclusion/exclusion criteria of DSM5 show sufficient reliability though, unsurprisingly, variation between different diagnoses exists.
Unfortunately, validity is altogether trickier than reliability because, while all validity introduces bias, there are many ways that bias can be introduced. This leads to there being several kinds of validity.
- Face Validity this is the best known type of validity. It simply means that the measure should seem to refer to its target.
- Content Validity requires a measure to cover all aspects of the target. For example, a depression measure should include enough questions to cover all the ways depression can present.
- Predictive Validity requires the measure to be able to predict other characteristics of its target, not included in the measure. These might include response to treatment, associated features, or prognosis.
- Criterion Validity means the measure should be able to detect some specified characteristic of its target. For example, a depression screen should be able to recognise when there are enough symptoms to make a diagnosis. The curse of dimensionality means we want no more.
- Construct Validity is the extent to which the measure truly reflects the nature of the target.
- Convergent Validity is when the measure tracks another measure of known validity when measuring the same target.
- Divergent (Discriminant) Validity is when the measure gives a different result to another measure, known to measure something else, when used on the same target.
Which type of validity is important depends very much on the purpose of the measure. For example, it is currently thought brain imaging provides good construct validity for many disorders. However, for most of these, criterion validity has not been established, so it is not widely used for diagnosis except in a few conditions, such as dementias.
The prime value of a diagnosis lies in its predictive validity, because that tells us what to expect, what to prepare for, and what treatments might work. It can be measured by correlating the measure with what it needs to predict, as this chart of different personnel assessment tools shows.
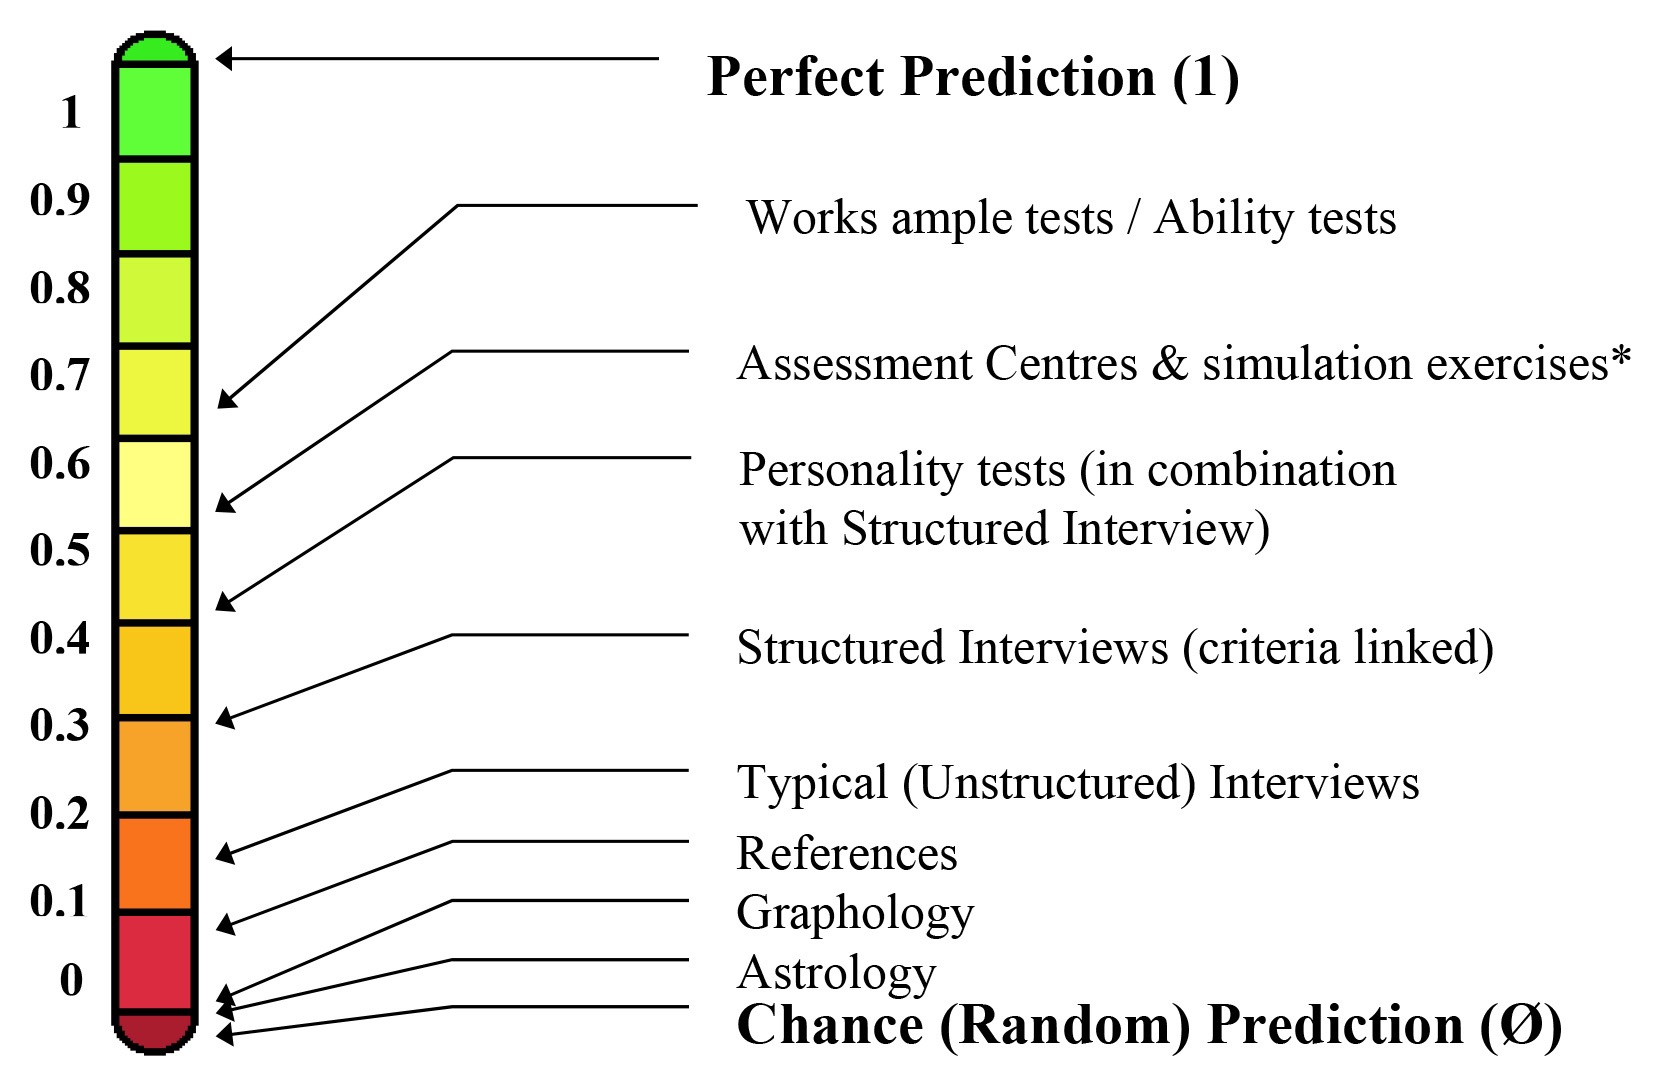
Predictive validity of different assessments of likely job performance
Asterisks indicate that the correlation is significant
Of course, to be used, a diagnosis also needs criterion and content validity, which leads to our next section.
Cutting the Rainbow
Psychiatric diagnosis has three components
- A set of signs and/or symptoms, defined as above.
- An abnormality criterion: the diagnostic features should be developmentally and socially unexpected.
- An impairment criterion: the diagnostic features should cause harm either to the patient or others, or both.
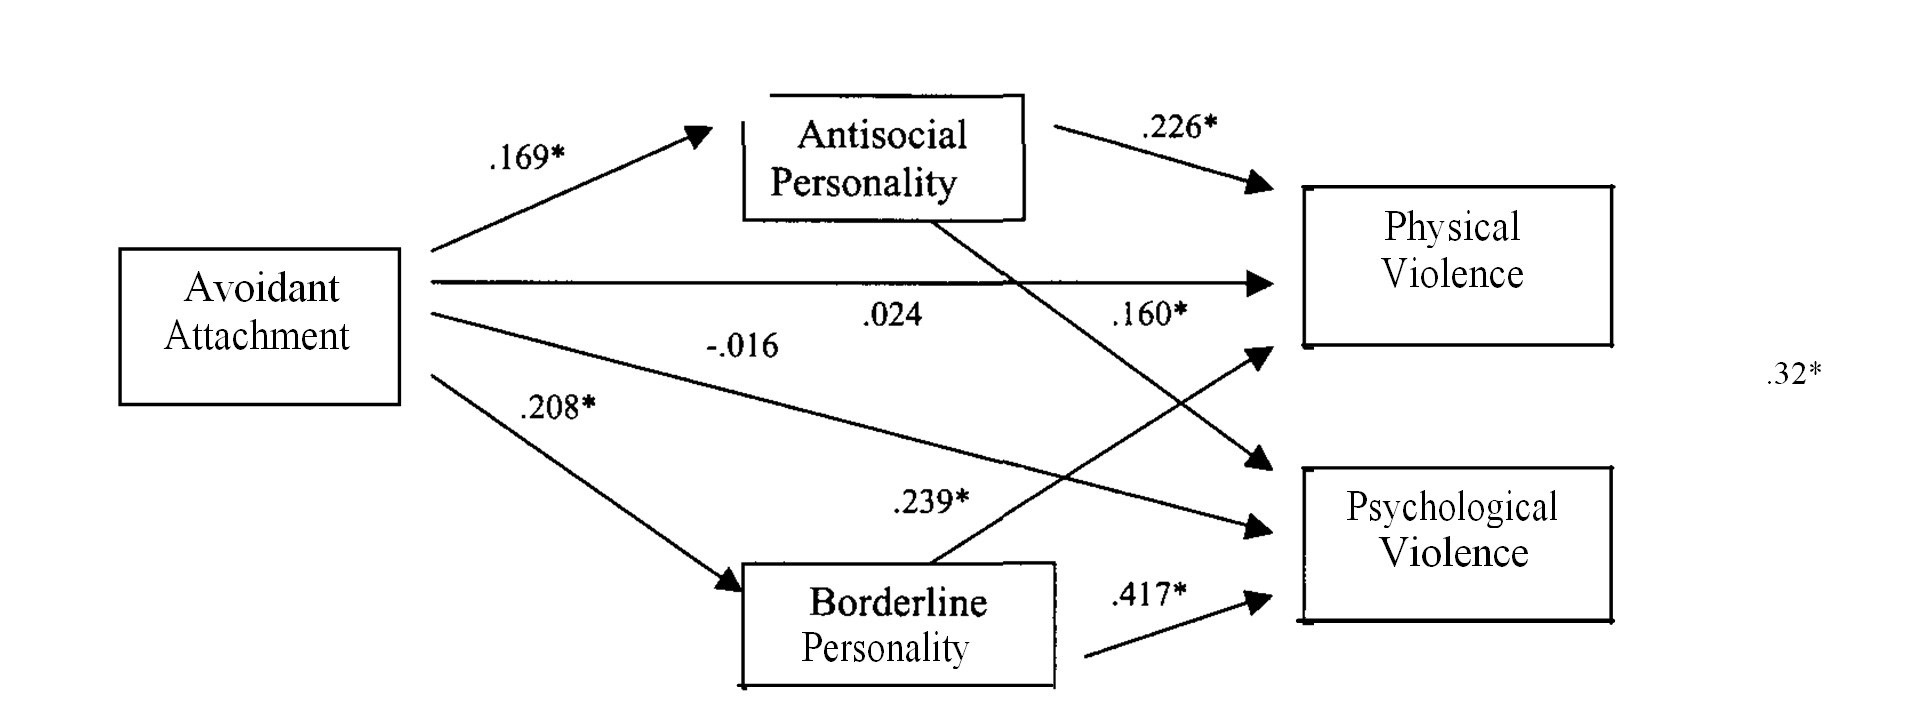
Avoidant adult attachment style doesn’t make the cut as a diagnosis, because, alone, it doesn’t meet either criterion 2 or 3, even though it is a risk factor, as we have just seen. However, both these criteria beg an important question. How should we set our cut-offs? After all, it’s pretty obvious that there are going to be borderline examples of both “abnormality” and “harm”. Only a little more thought is needed to apply the same boundary question to the symptomatic criteria also. We are no longer with our convenient rainbow cartoon, but the real thing, and need to tackle its fuzziness head on.
Latent traits and latent classes
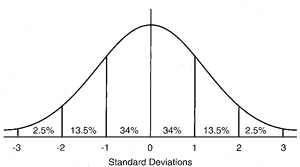
The normal curve. The percentages refer to the proportion of the population in the labelled segment of the curve
Many things in our population either follow, or can be transformed to a curve like the one above, where the unit of measurement of the thing we’re measuring is standard deviations from the mean score. Long tradition has suggested that either a 5% or 2.5% cut-off works well in defining abnormality. If we think back to our discussion of the curse of dimensionality, to impose such a cut-off in addition to adding the extra dimension (or two) associated with the distributions of abnormality and impairment is pretty stringent, so if we are able to identify such a diagnosis reliably means it has passed a high bar, albeit we often cannot do more than guesstimate these. However, we can also tackle the issue directly.

Finding hidden categories in continuous measurement
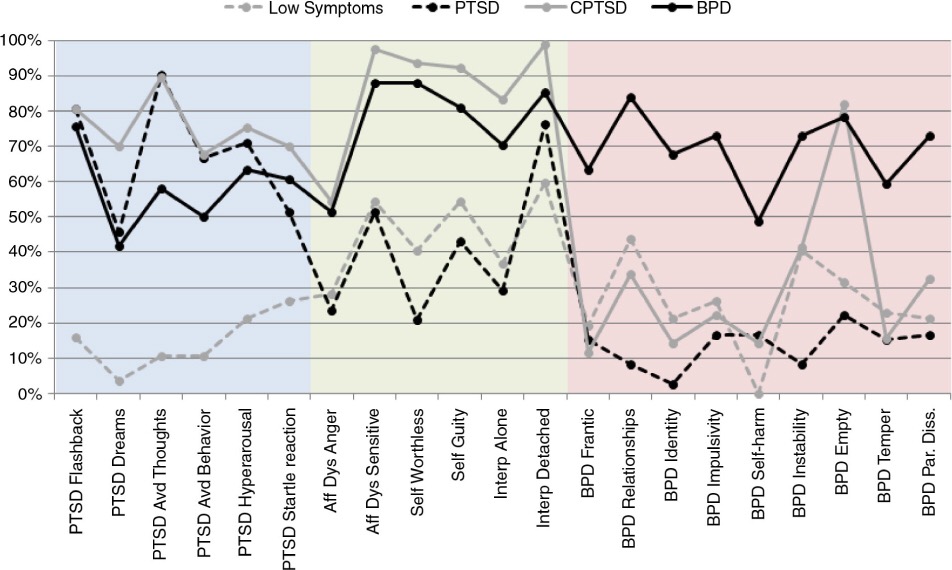
The colours simply indicate how the questions reference different disorders
If we assume (quite reasonably) that abnormality and impairment correlate with symptom count, then, despite using continuous measurement, we can identify four distinct classes, including a group without sufficient symptoms to meet disorder criteria. Just like our rainbow’s colours, we can find evidence of separate categories of disorder. Here, Borderline Personality Disorder (BPD) may be distinguished from both simple and complex presentations of Post-Traumatic Stress Disorder (PTSD).
We can do the same trick the other way round.
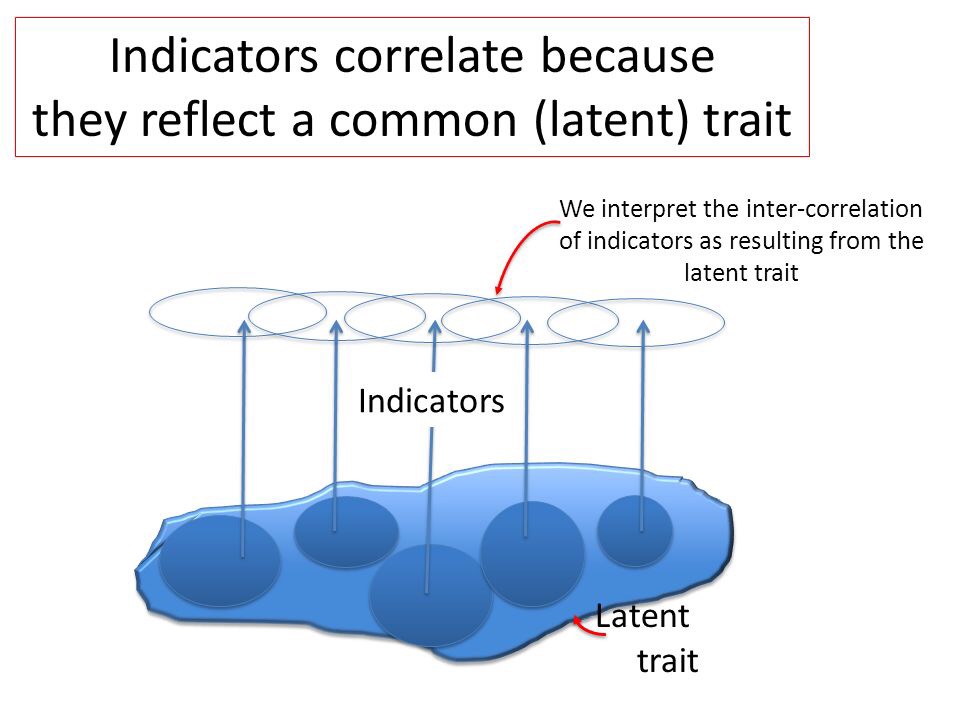
“Indicators” can include one or more diagnoses
In this example, the finding of a single latent trait covering both dependence and abuse led to a recommendation to combine these into a single category in DSM5.
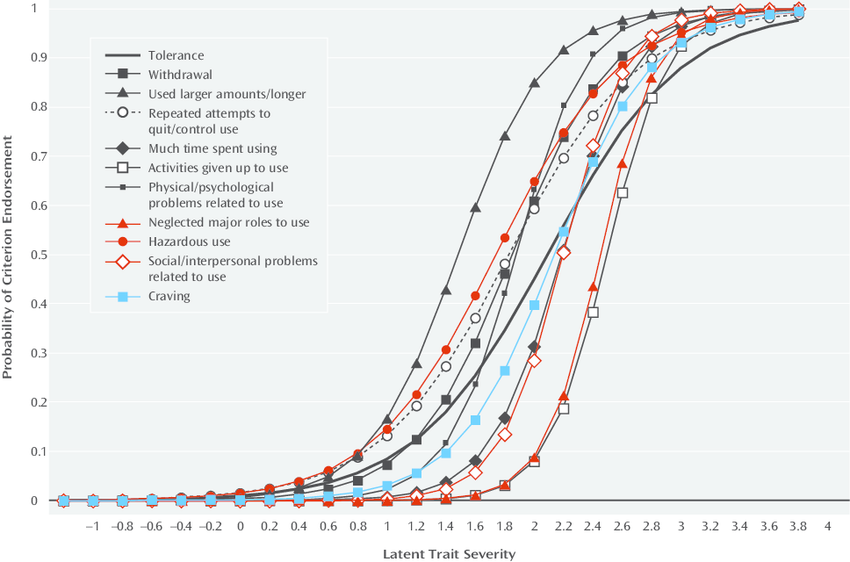
Two categories (dependence and abuse) sharing a single latent trait
As the diagram shows, our rainbow arises because we model the continuous spectrum by different levels of excitation of these three receptor types. This is effectively a kind of latent trait analysis. Conversely, neuronal measurement of different receptors allows us to deduce the latent classes also present in our rainbow, as well as precisely modelling the wavelength they receive. Even though the receptors represent latent classes, when combined they provide enough predictive validity to let us model the entire spectrum of visual light. In diagnosis we have begun to do something similar, with increasing use of the concept of comorbidity, while the term “spectrum” is now formally applied to autistic disorders in DSM5. Unlike the rainbow, in diagnosis we frequently cannot be sure whether dimensions or categories have better construct validity. However, as our primary goal is to establish predictive validity, the science allows us to see that diagnostic categories and dimensions (with cut-offs) may be interchanged, so our modelling may be fit for the purpose we intend.
We can also say that the diagnoses we now use are no longer expert guesstimates, but reliable and valid categories that are backed by good science. They will continue to evolve as our ability to measure mental symptoms improves.
